Data Made Simple with Metabase
by Mohammad Hussain and Syed Sibtain,
Introduction:
Data analysis shouldn’t require deep SQL expertise or a massive budget. Metabase, the open-source business intelligence platform, changes that by making powerful analytics accessible to everyone through an intuitive, no-code interface.
Whether you're tracking user metrics, analyzing business performance, or creating executive dashboards, Metabase transforms your raw data into beautiful, interactive visualizations in minutes.
Exploring Metabase as a Reporting and Visualization Tool
In modern applications, the ability to analyze data, create visualizations, and share insights with teams is just as important as building the product itself. For developers and organizations, Metabase provides an excellent open-source solution for reporting and visualization.
In this blog, I’ll walk through my experience of setting up Metabase locally, connecting it to a PostgreSQL database, creating visualizations, embedding dashboards inside an application, and exploring role-based access control (RBAC).
🎯 Objective
The primary objective was to explore Metabase’s features by:
- Setting up a self-hosted Metabase instance locally.
- Connecting it to a project’s PostgreSQL database.
- Creating charts and dashboards to visualize the data.
- Embedding dashboards inside a web application.
- Evaluating role-based access control (RBAC) for managing permissions.
⚙️ Metabase Local Setup (Self-Hosted)
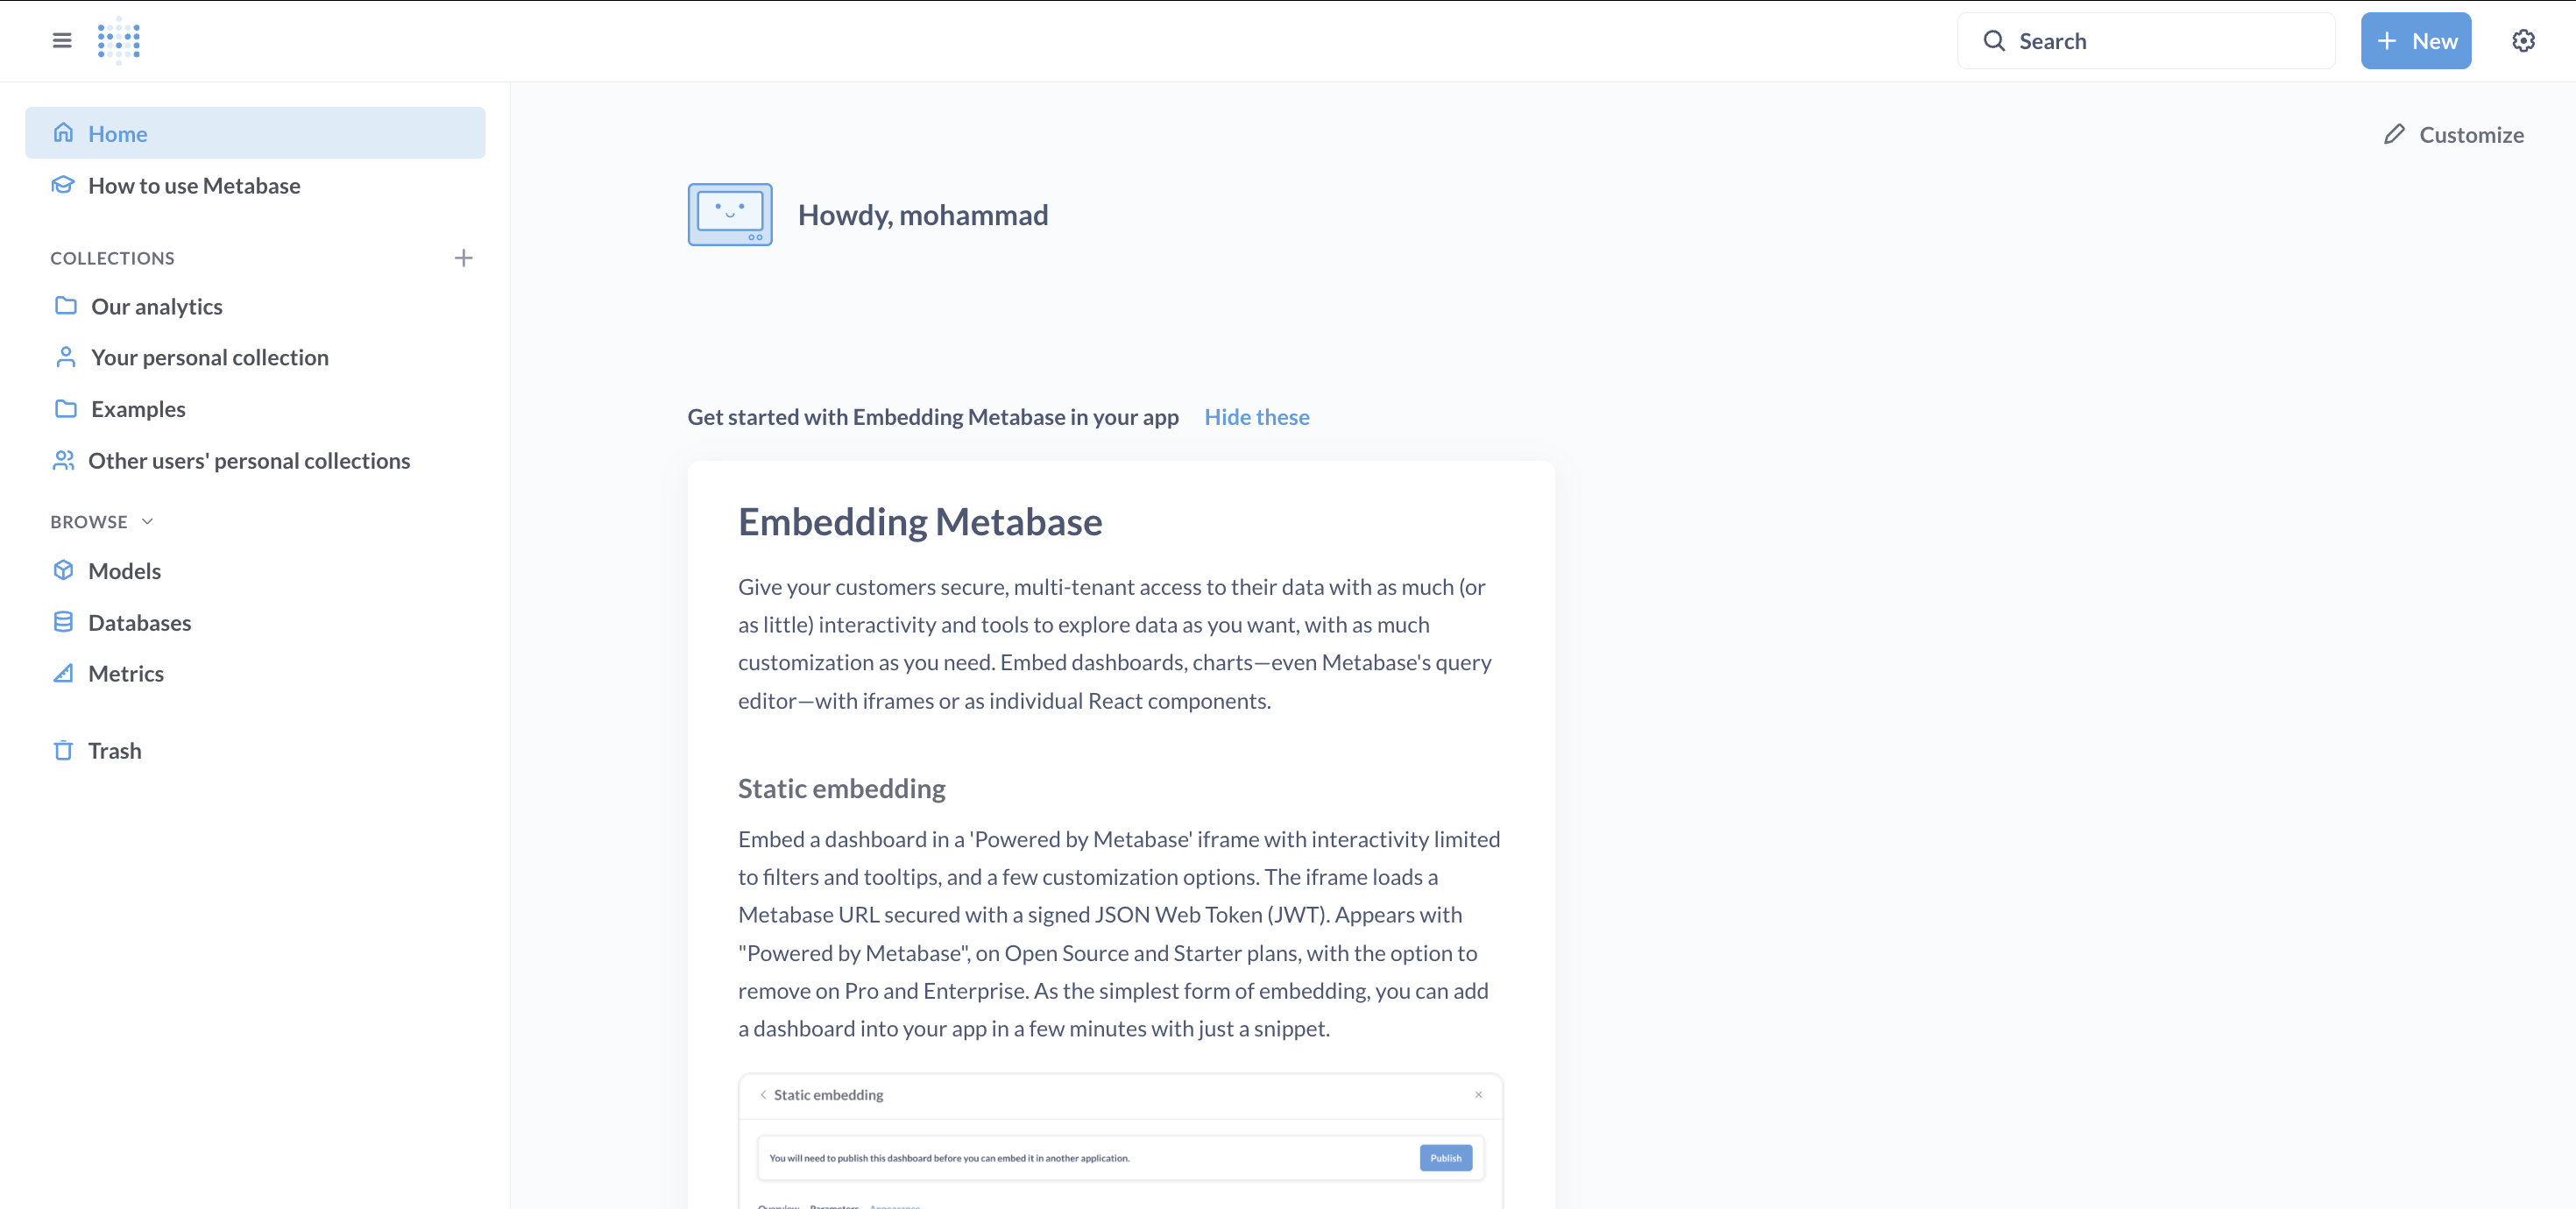
To start, I set up Metabase locally using Docker Compose.
- Pulled the official Metabase Docker image and configured it in a docker-compose.yml.
- Exposed the service at port 3001, since my Rails server was already running on 3000.
- Once the container was up, I accessed the UI at: http://localhost:3001.
- The setup process was smooth, and within a few minutes, I had the Metabase login screen up and running.
Learn more in the Metabase Docker setup guide.
🗄️ Database Integration
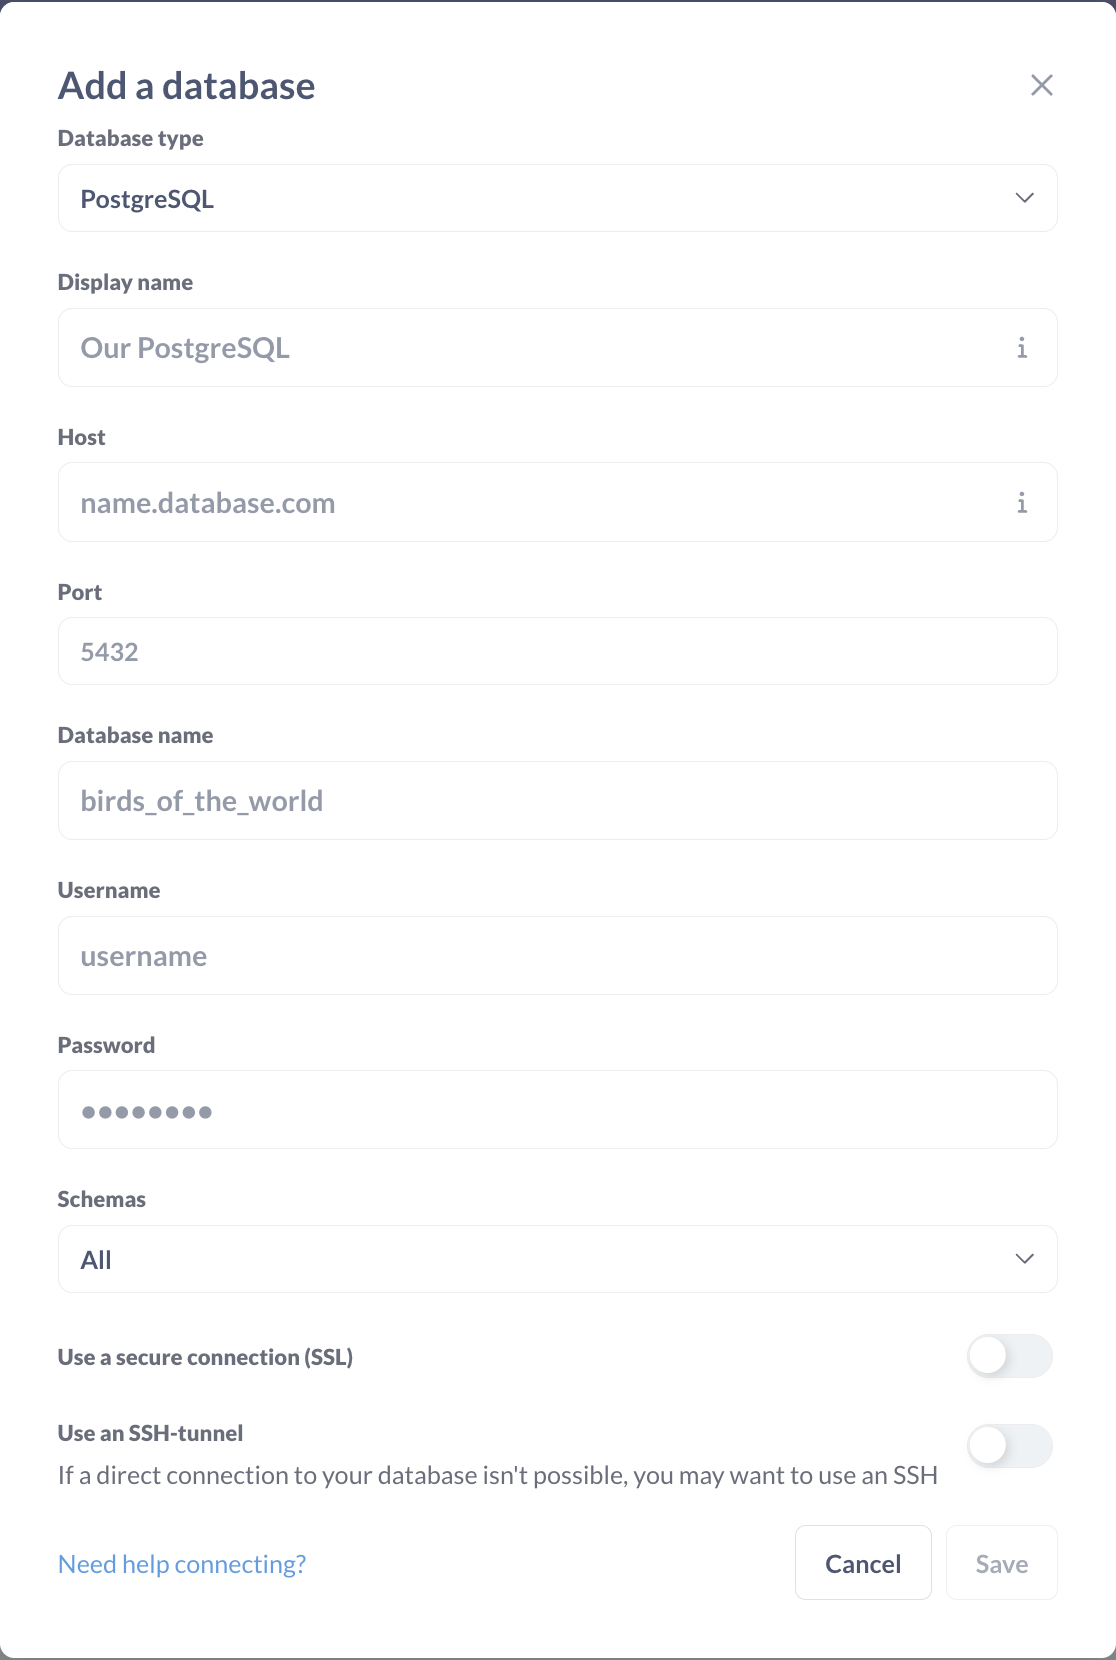
After the initial setup, the next step was to connect Metabase with the local PostgreSQL database used in our project.
- Configured the connection settings (host, port, username, password, and database name).
- Verified that all tables were visible in the Metabase interface.
- Ensured tables were visible in the Metabase interface.
- Ran a couple of sample queries to confirm data connectivity.
This step ensured that Metabase had access to all the project’s data, which could then be used to build meaningful charts. You can read more about PostgreSQL connections in Metabase’s official guide.
📊 Question and Chart Creation
In Metabase, everything starts with a Question.
A Question is essentially a saved query that pulls data from your database and turns it into a chart, table, or metric.
Questions can be created in two ways:
-
From Tables (GUI Query Builder) – Select a table (e.g., Departments) and apply filters, groupings, and aggregations without writing SQL.
-
Using the SQL Editor – Write custom queries when you need joins, calculated fields, or more advanced logic.
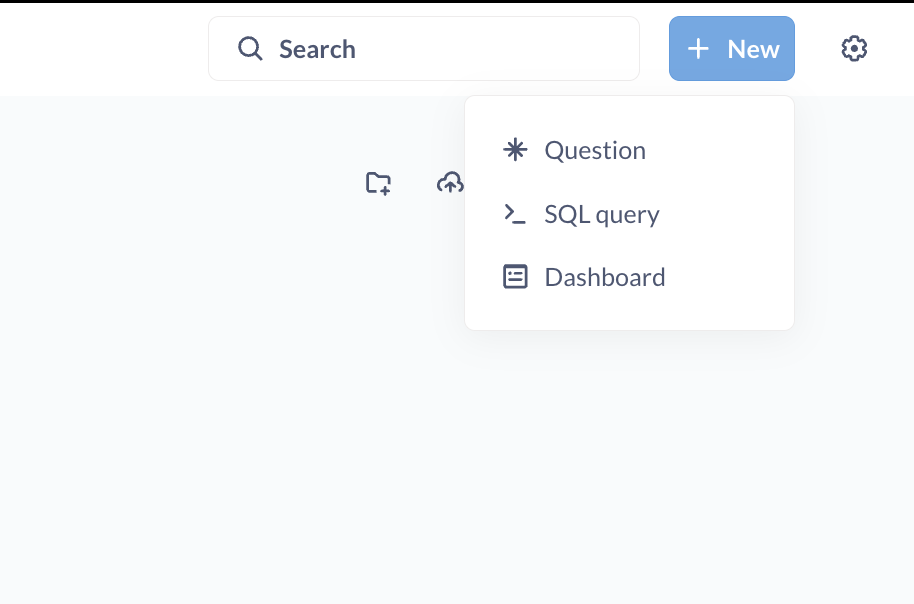
To create a question, click on New and choose either Question (for the GUI) or SQL query (to use the SQL editor). Next, select the required table, and then choose from different chart types to visualize the data. Once you hit Save, the question will be created.
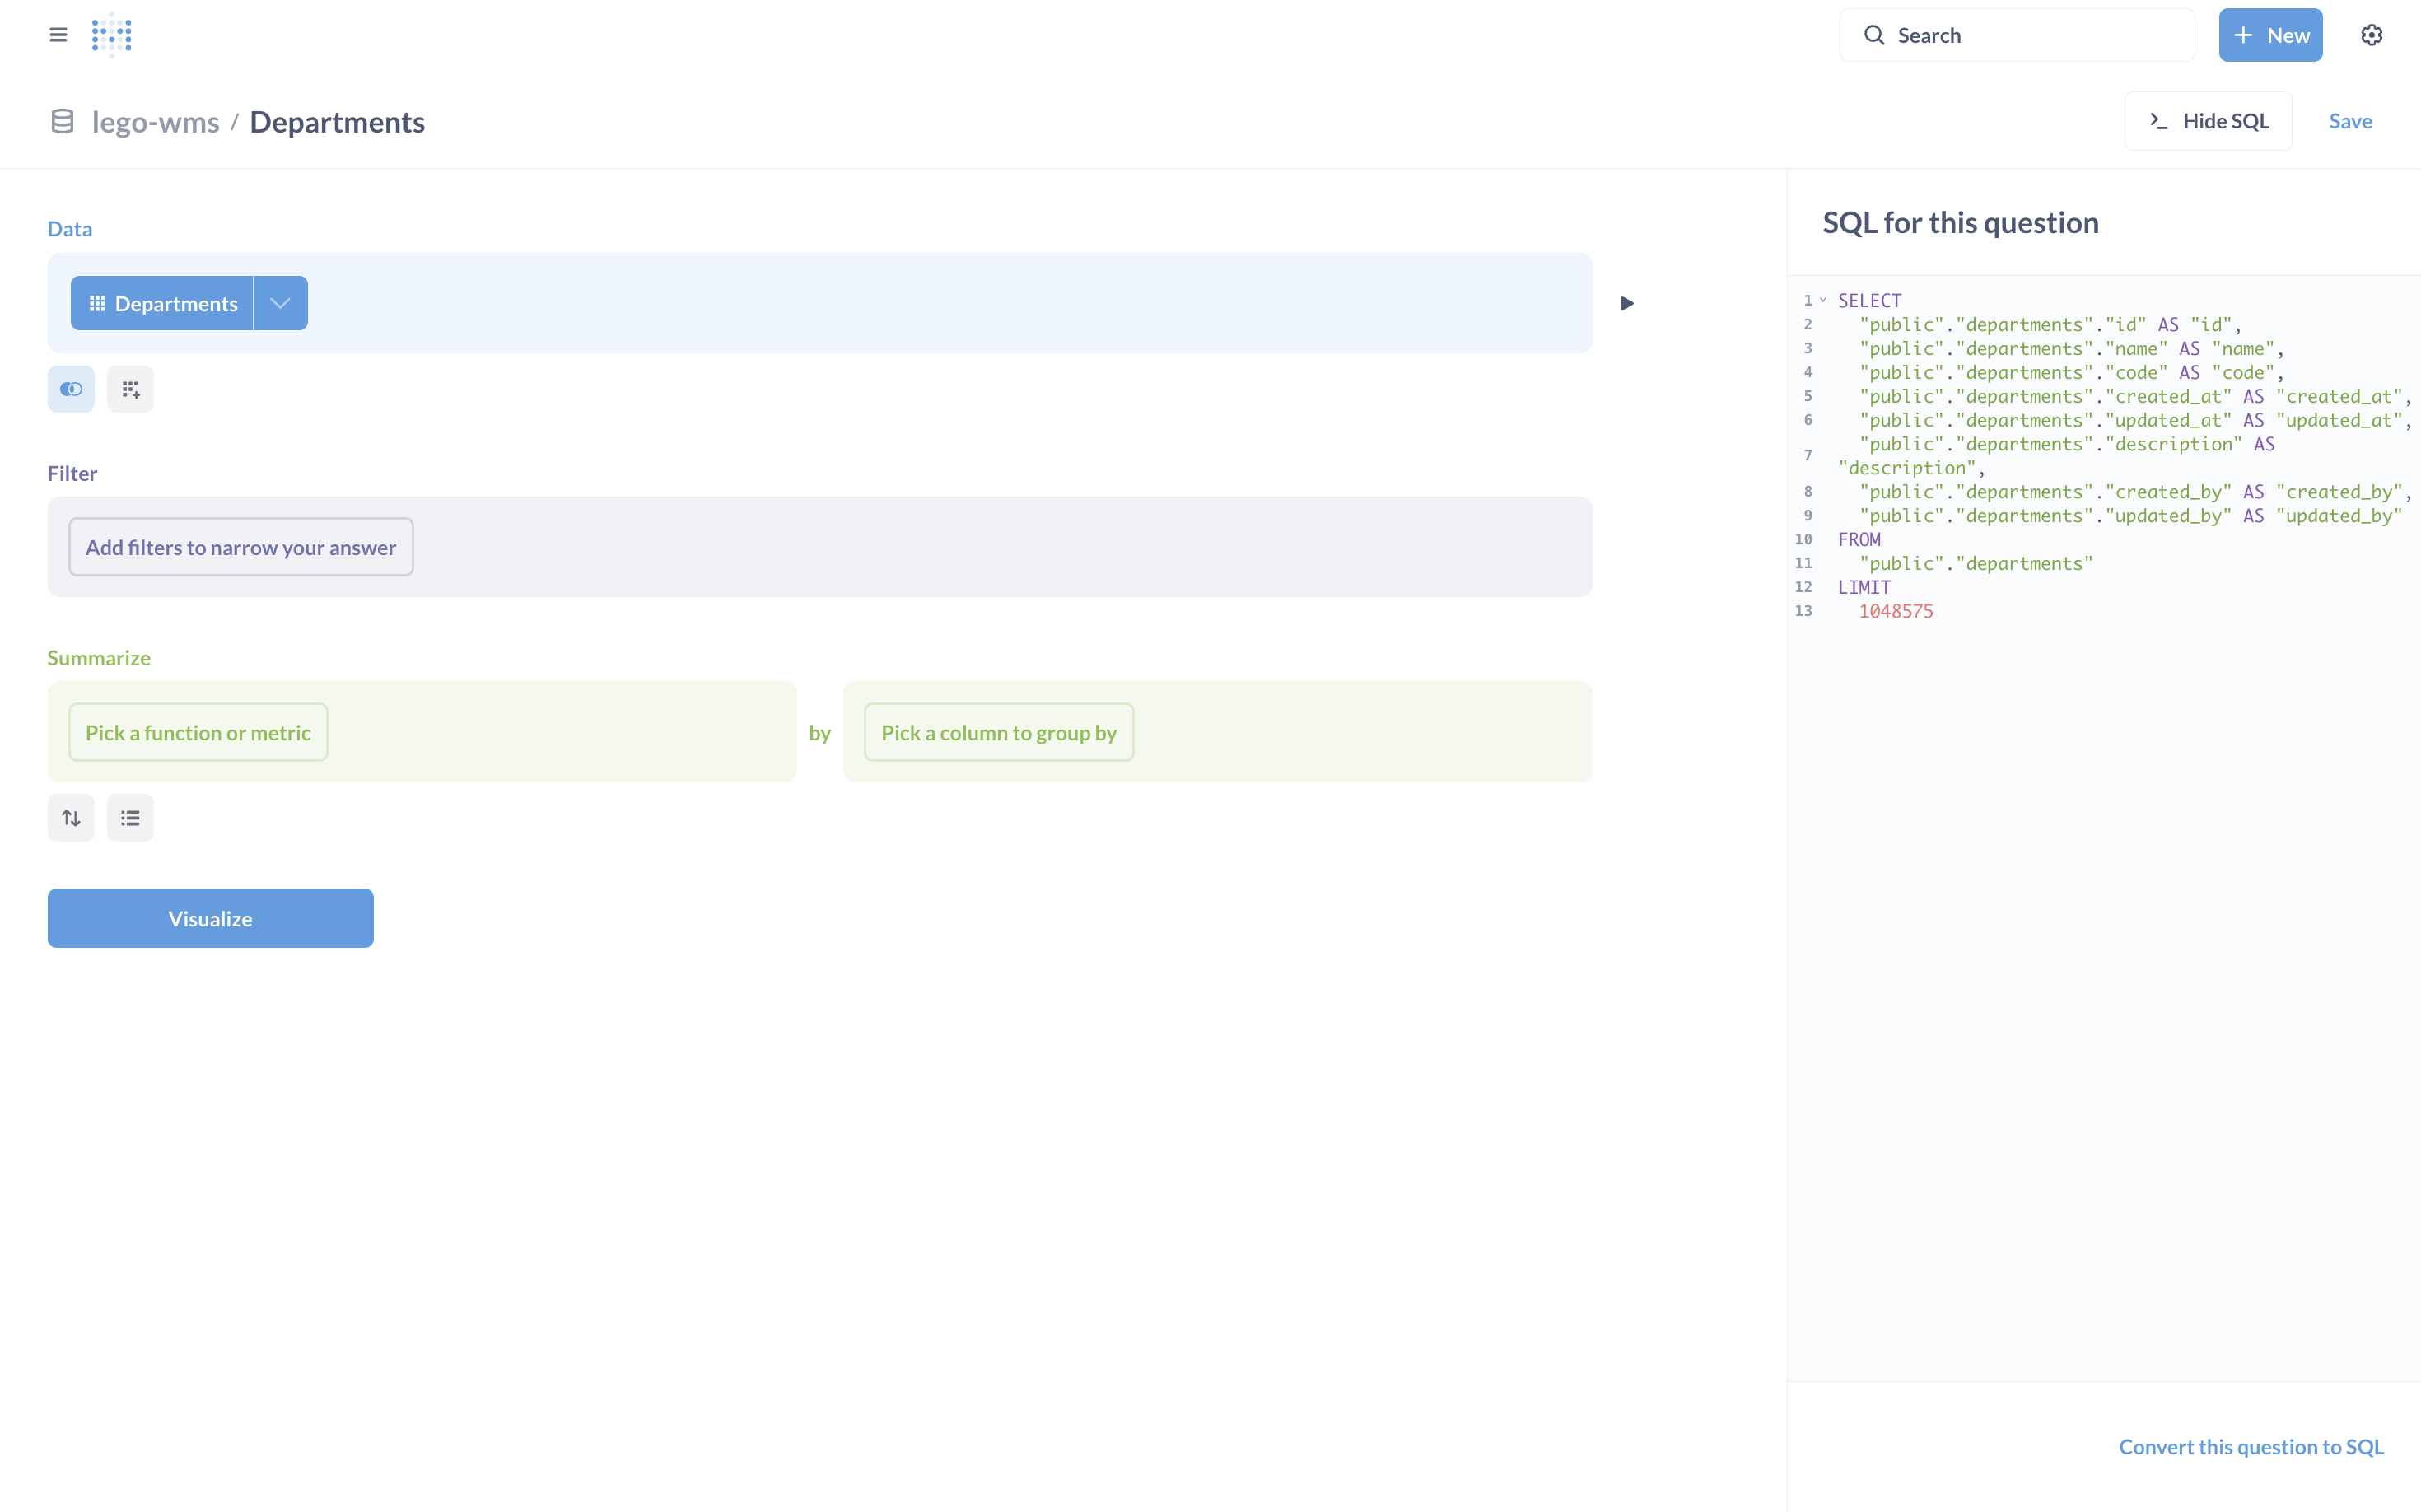
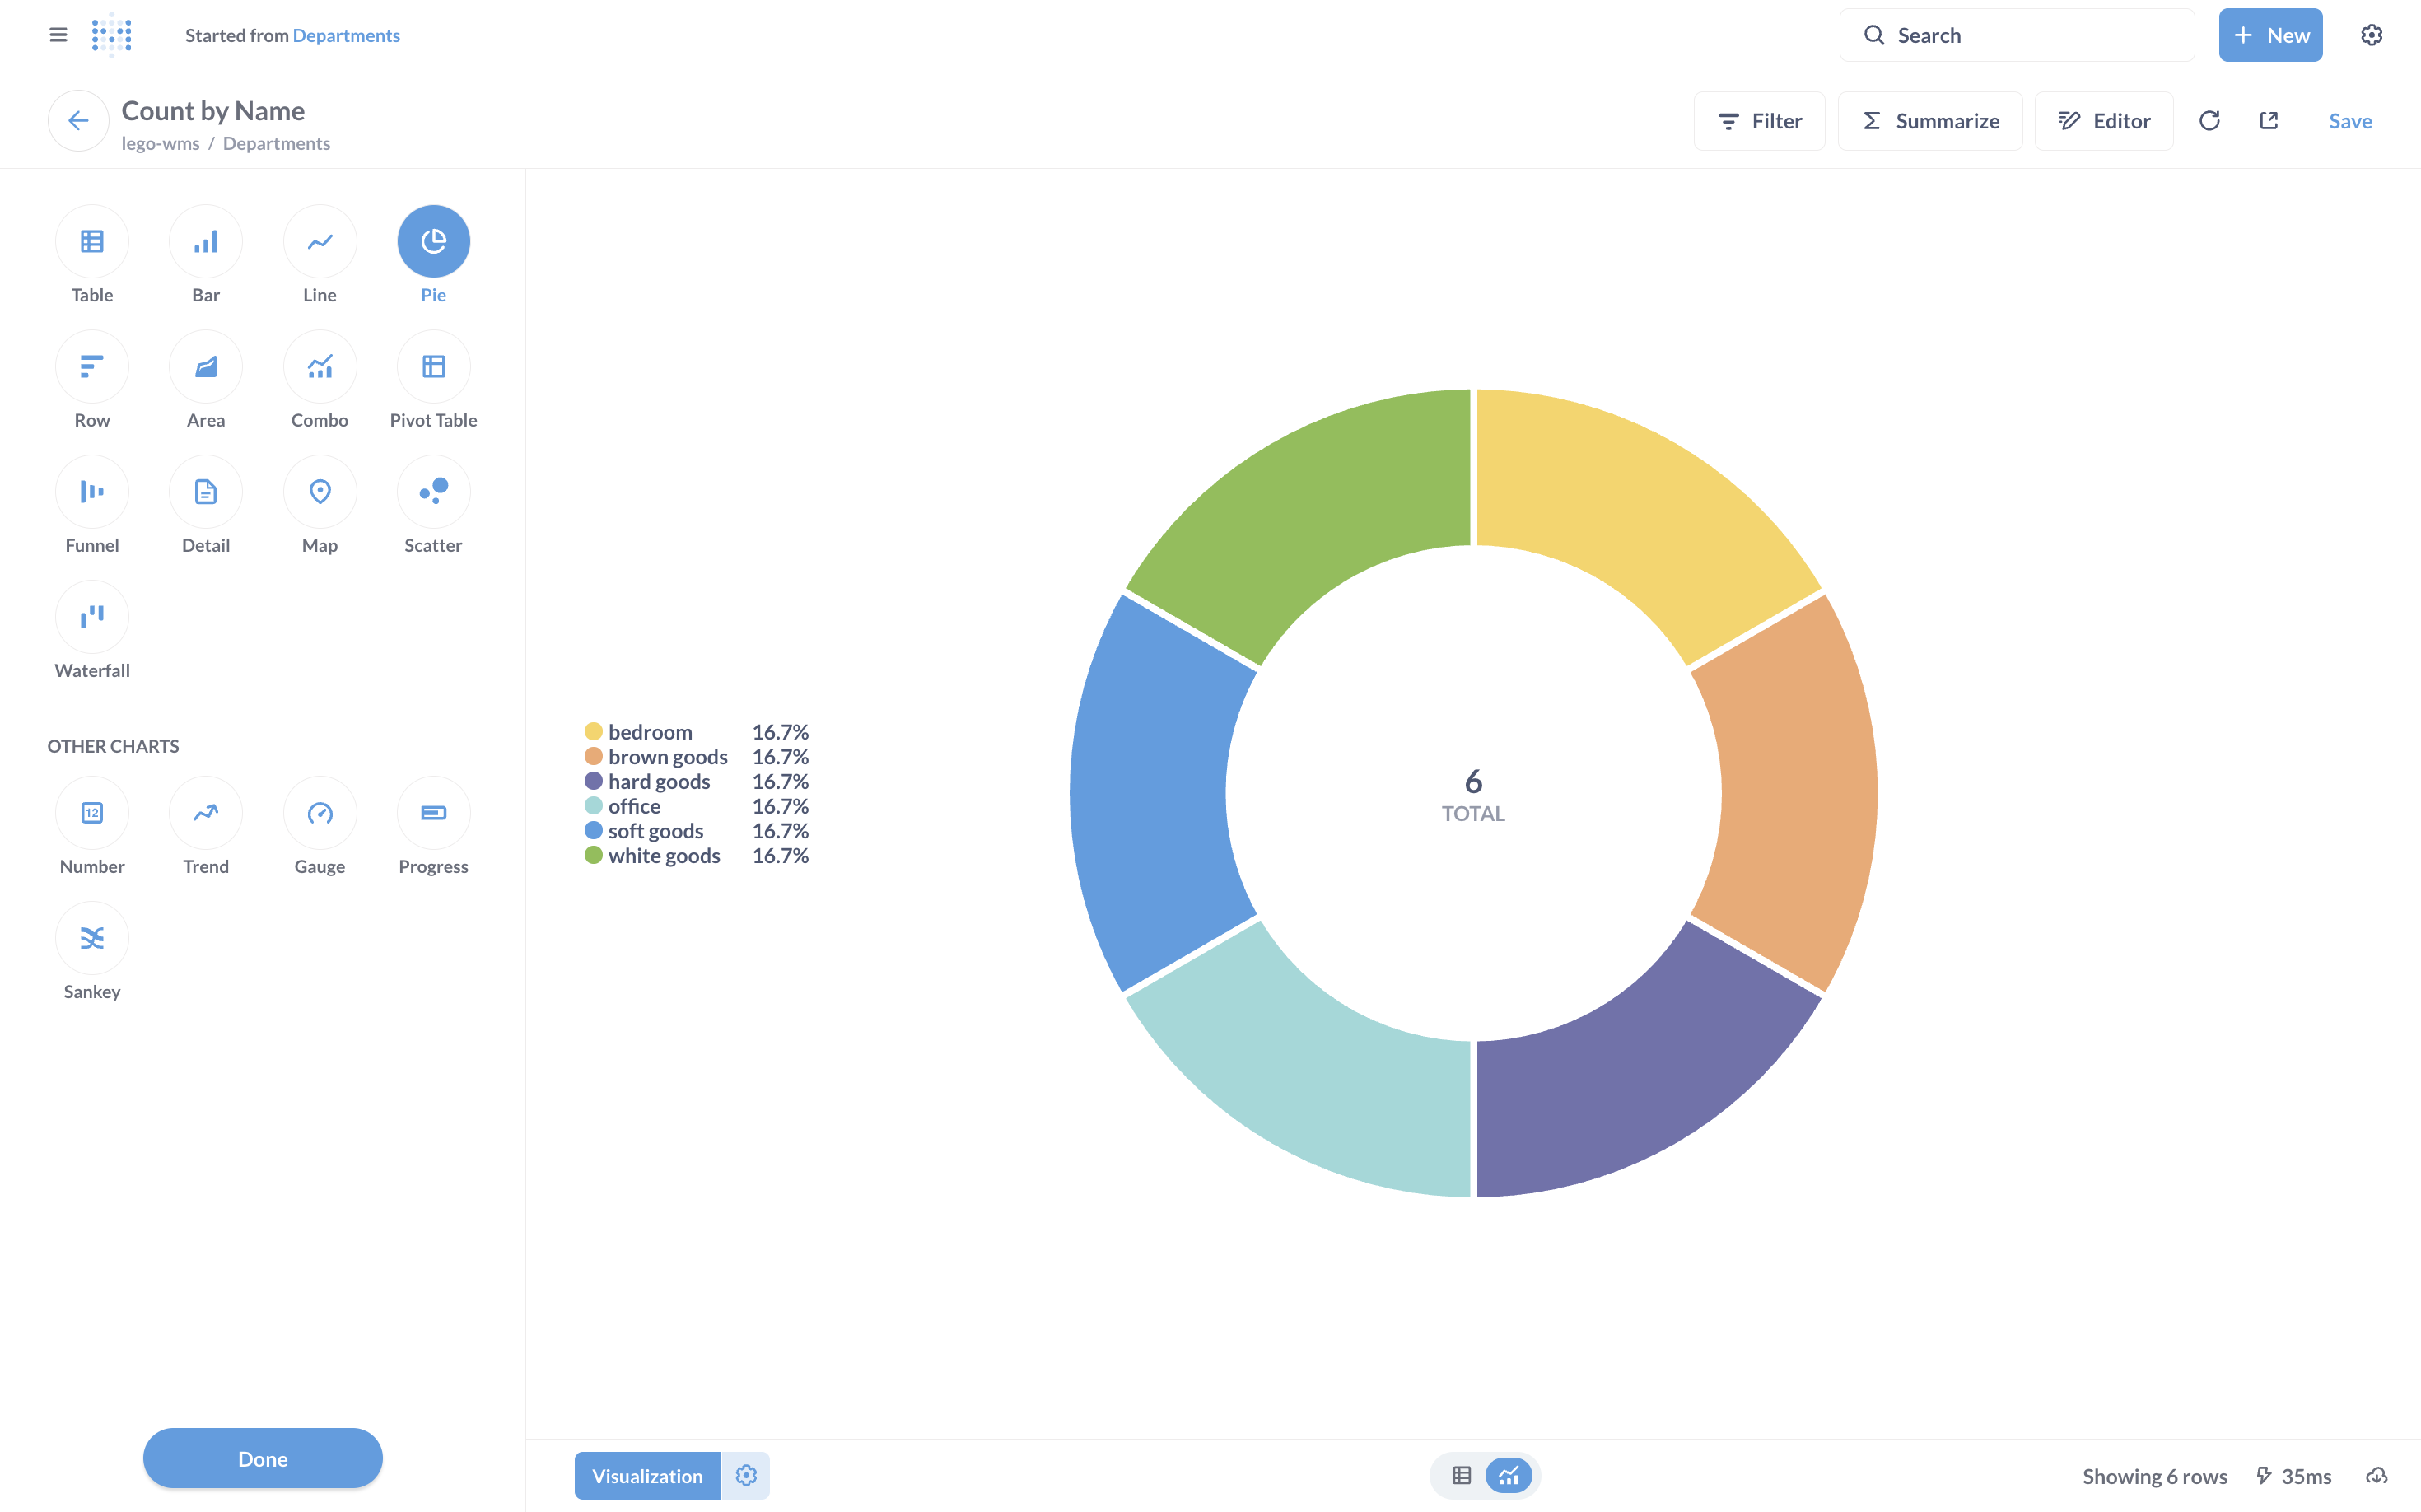
For example, I created a Question such as:
Department-wise Summary – Starting from the Departments table, I grouped by department and visualized activity counts.
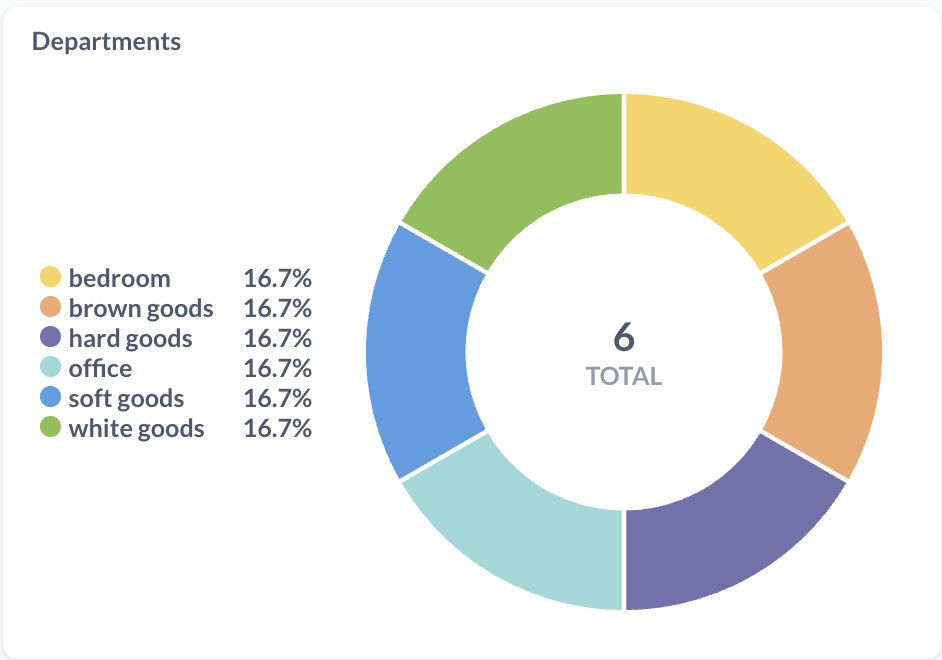
This exploration highlighted how both technical and non-technical team members can quickly create useful insights.
📋 Dashboard Setup
Once charts were created, I grouped them into a sample dashboard.
- Added all the charts to a single dashboard view.
- Customized the layout for readability and logical grouping.
- Verified that charts were interactive (hover, filter, drill-down).
This dashboard served as a consolidated view of key metrics from the project database.
🌐 Dashboard Embedding
One of the most powerful features of Metabase is dashboard embedding.
- Enabled secure embedding in the Metabase admin settings.
- In the dashboard page, under the Sharing section, you’ll find an Embed option. By clicking on it and selecting Static, you’ll get an iframe along with some keys. These keys can be set as environment variables in your application. Then, by defining the appropriate routes, we can render the iframe.
- Embedded the sample dashboard inside the web application.
- Verified that the dashboard rendered correctly within the application.
- Tested responsiveness and interactivity to ensure a seamless user experience.Feel free to explore more about embedding capabilities in the Metabase Dashboard Embedding guide.
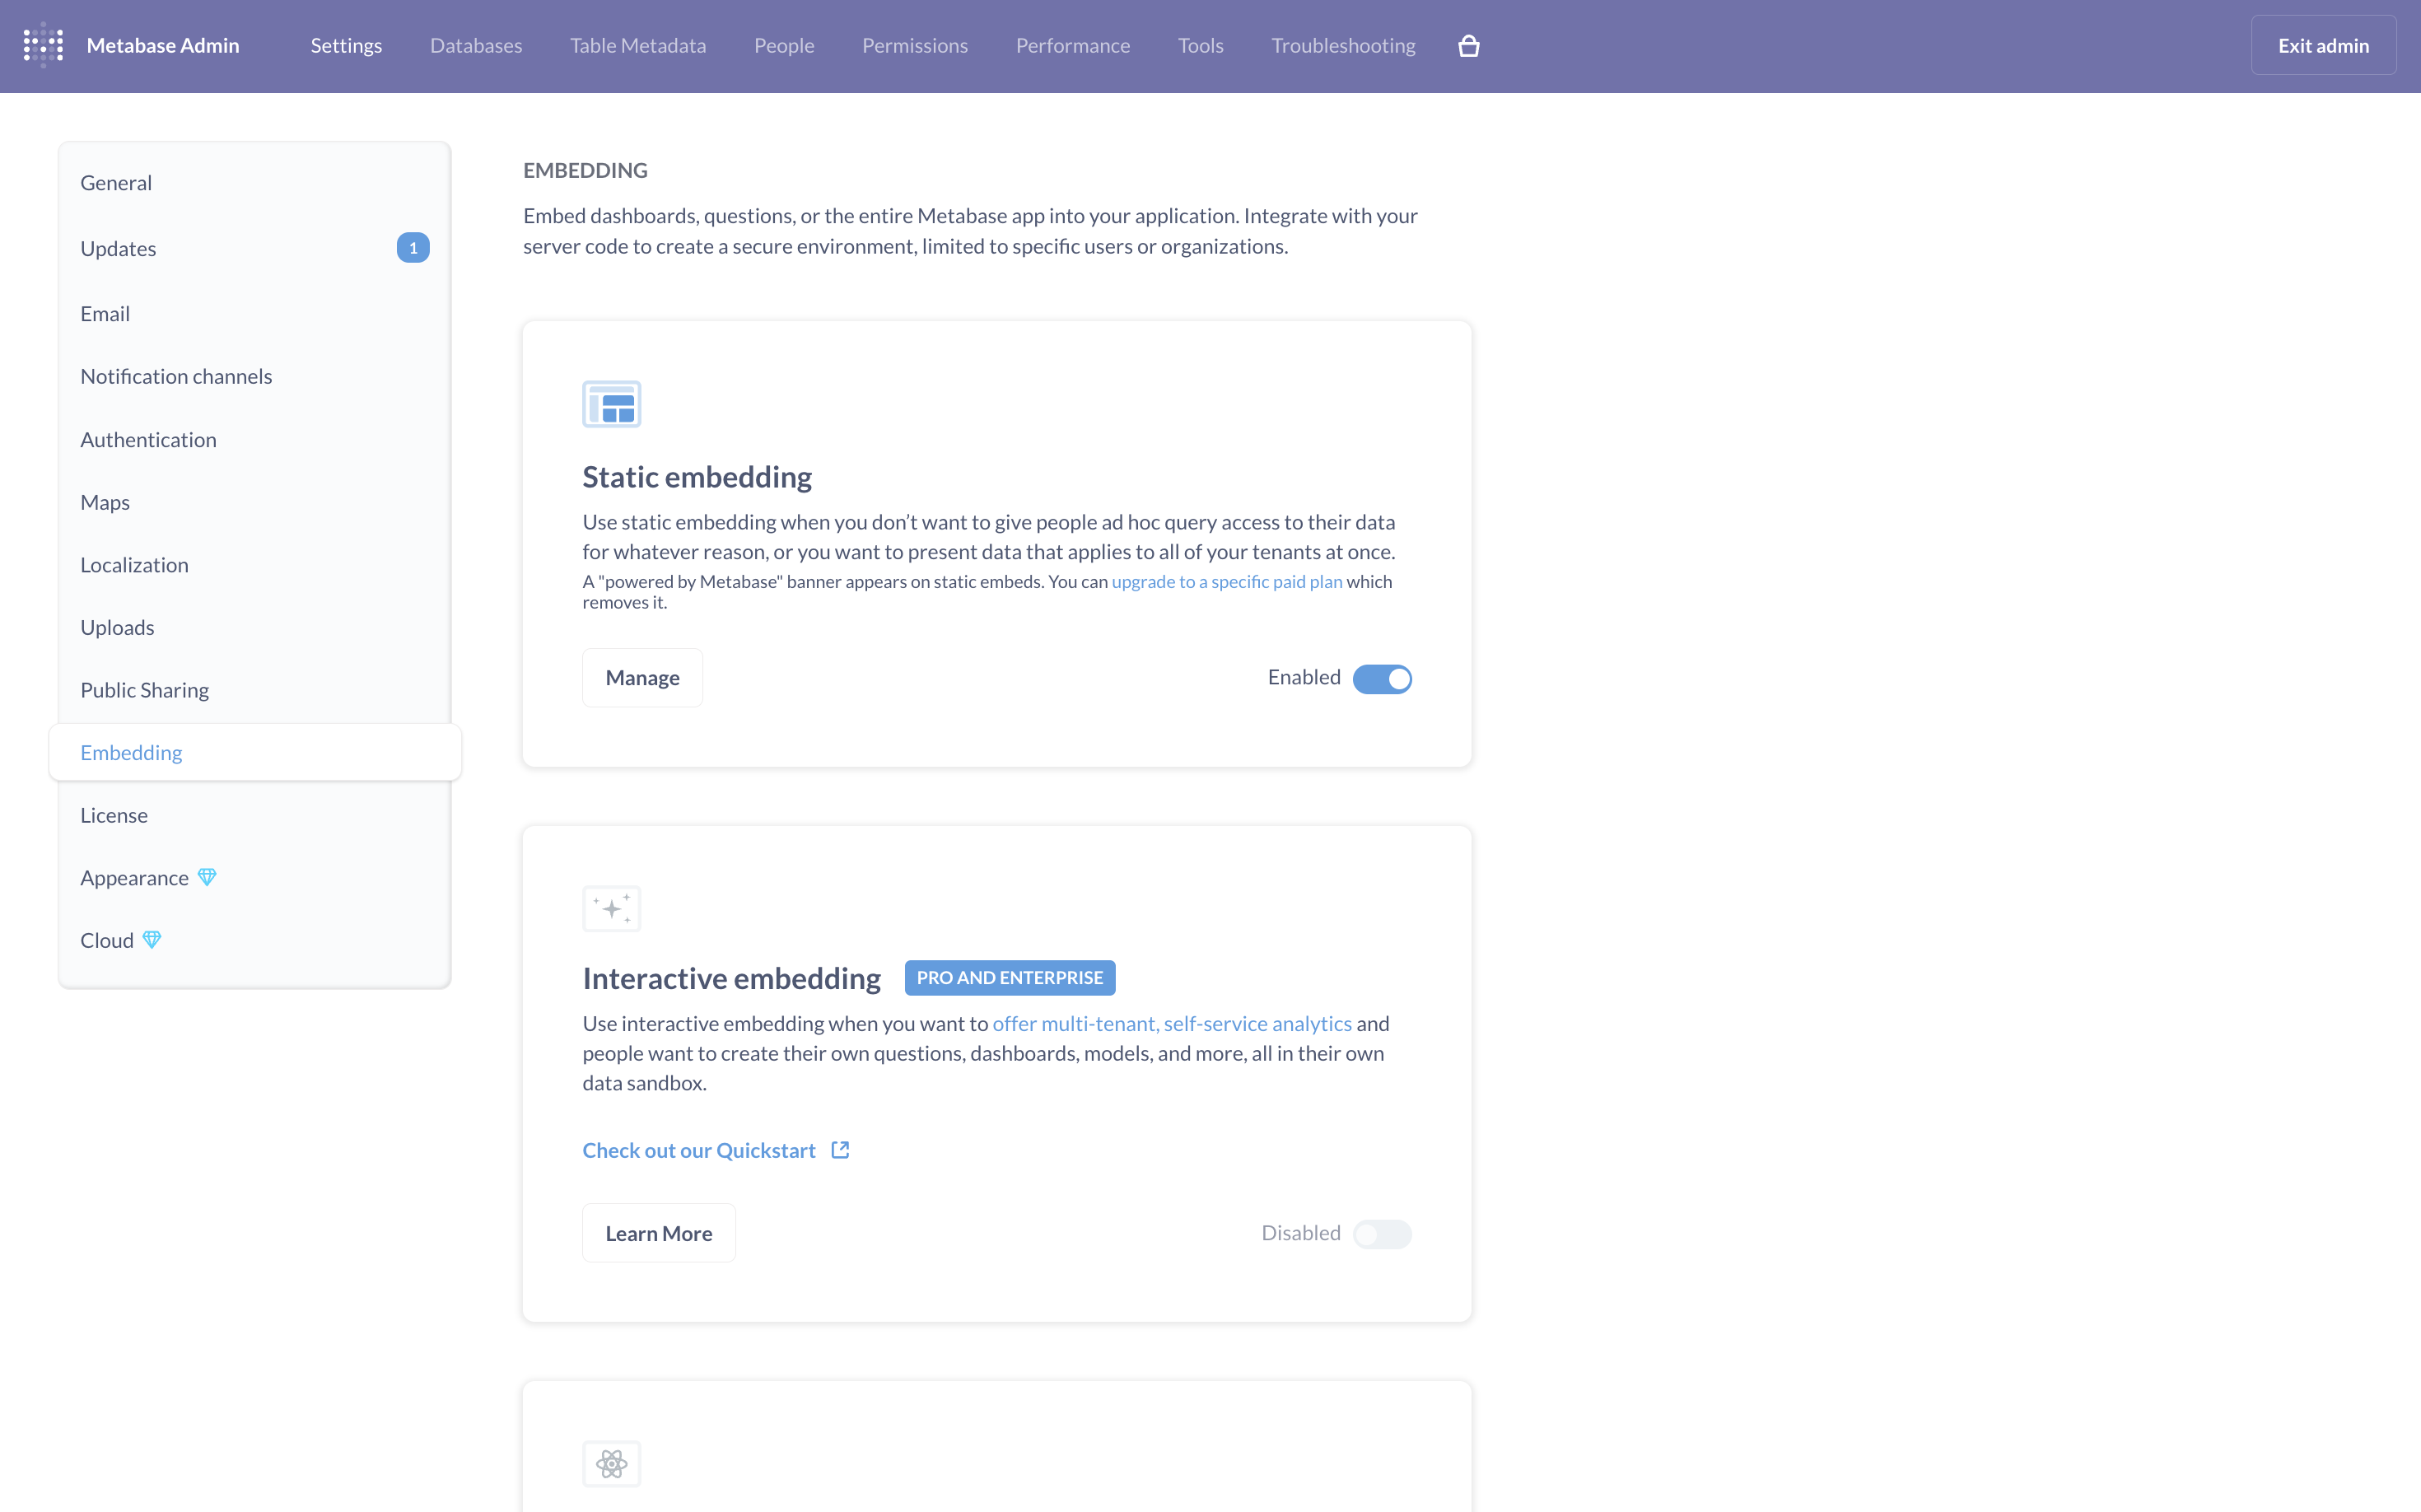
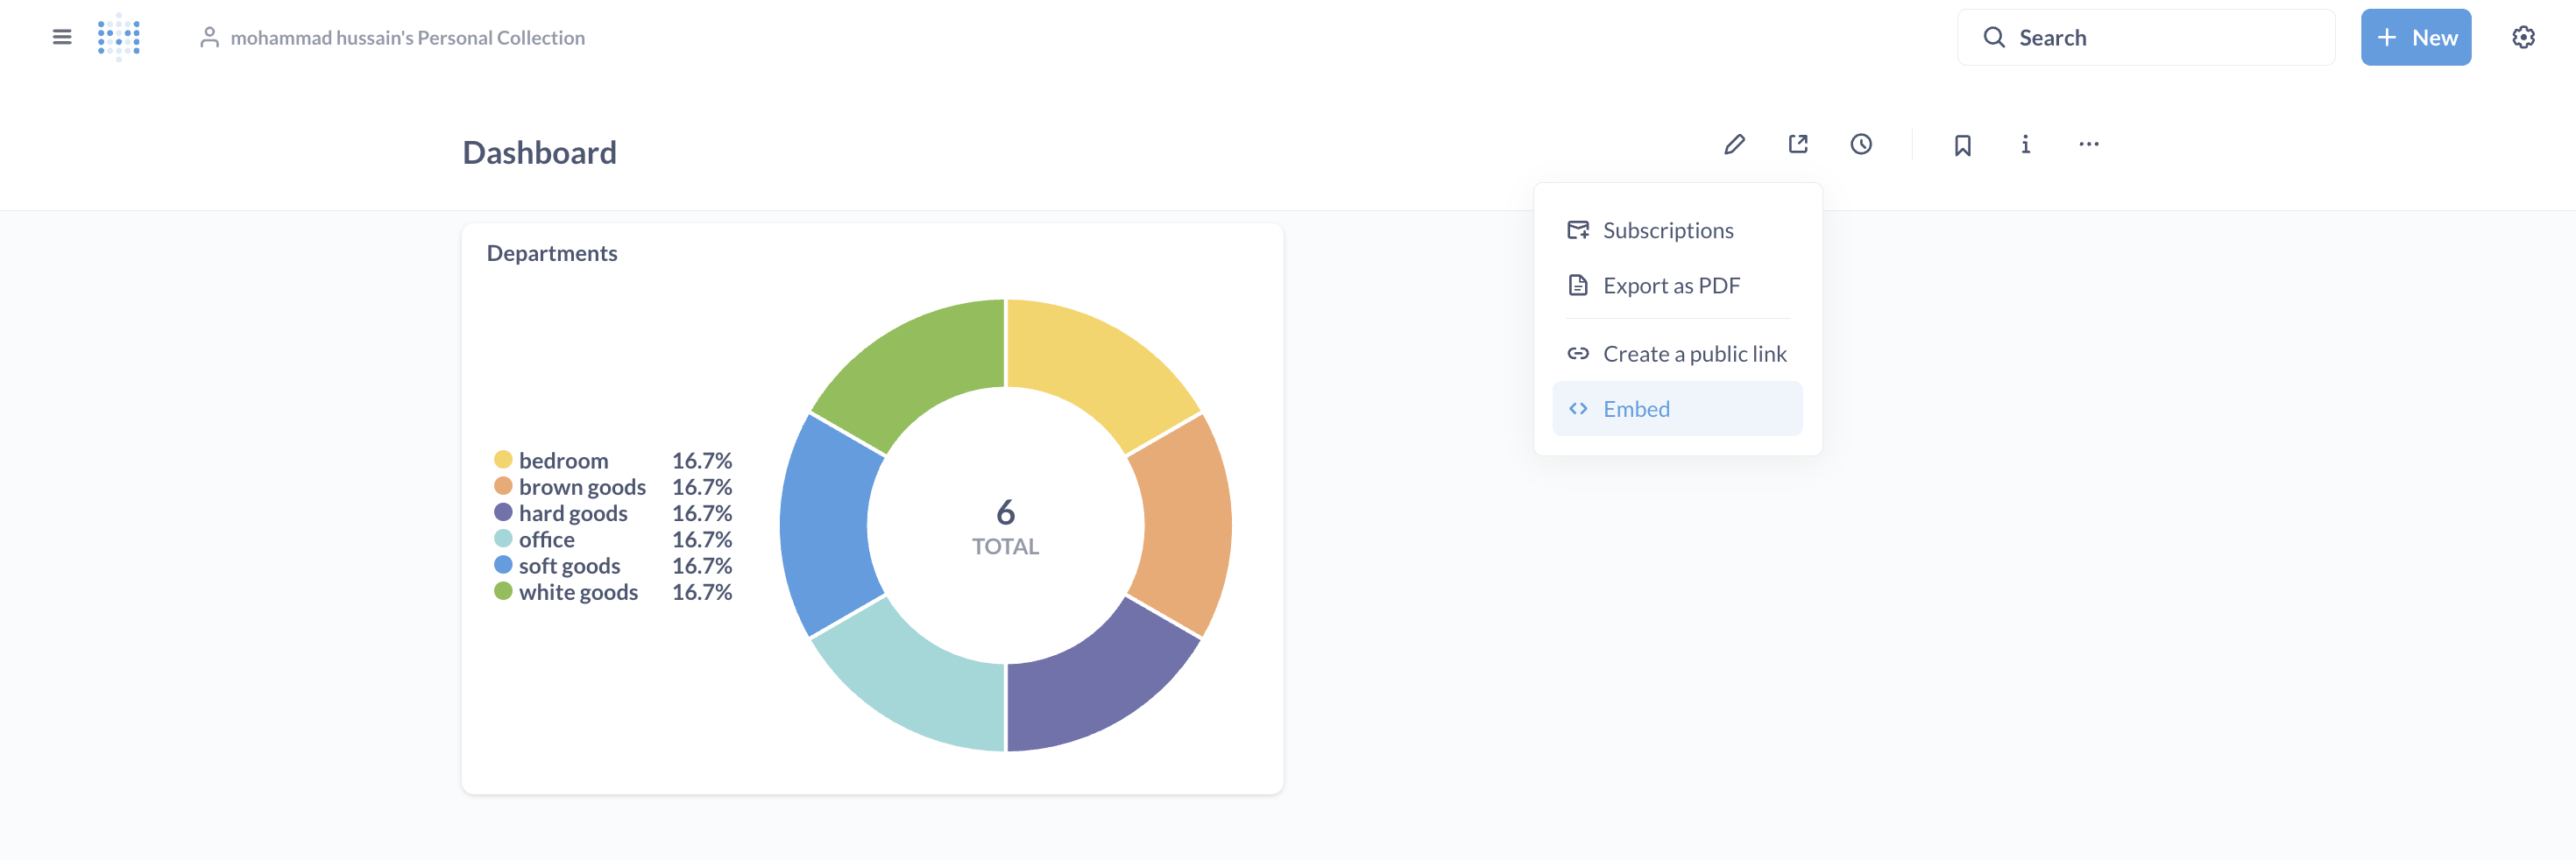
This step proved how Metabase can be integrated directly into an application, giving end users direct access to live reports without leaving the system.
🔐 Role-Based Access Control (RBAC)
Data security and access control are critical in reporting tools. Metabase provides RBAC through its Groups and Permissions feature.
- Created custom groups (e.g., Managers, QC Team, Developers).
- Configured permissions at the collection level to restrict access to specific dashboards.
- Verified by switching between test users assigned to different groups.
- Ensured that unauthorized users could not view or modify restricted collections.

This functionality makes it possible to safely share dashboards across teams without compromising sensitive data.
Thanks for Reading! 🎉
If you’ve made it this far, congratulations on setting up and exploring Metabase! You’re now part of the group that knows how to turn raw data into clear, interactive dashboards and insights.
Remember, while this setup might feel like just a small step, you’re actually making data more accessible, improving decision-making, and empowering your applications with better analytics. That’s definitely worth celebrating! 🚀
Happy exploring, and may your dashboards always be insightful and impactful! 📊✨