Turn Data into Insights with Apache Superset
by Mohammad Hussain, System Analyst
Introduction
Digging into data doesn't have to be complicated or expensive. Apache Superset is an open-source tool that lets us explore, visualize, and share our data through an easy-to-use, modern interface.
Whether we want to create interactive dashboards, run quick explorations, or spot trends in large datasets, Superset helps us turn raw numbers into meaningful insights in just a few clicks.
Getting Superset Up and Running
For more flexibility, I also tried cloning the official Superset GitHub repository. This approach allows working from a specific release branch and customizing configurations through the superset_config.py file. Once the containers are launched with Docker Compose, Superset becomes accessible at http://localhost:8088 with the default credentials (admin/admin). The onboarding process is simple and quickly leads to the exciting part — connecting data. For detailed steps, refer to the official quickstart guide
Bringing Data into Superset
The next step was to connect Superset with my PostgreSQL database so I could start working with real project data. Superset makes this process straightforward through its UI.
Here's how it works:
-
Open the Settings menu and navigate to Database Connections.
-
We'll see a list of available databases. Click on the ➕ Database button to add a new one.
-
Choose the type of database we want to connect to — for example, PostgreSQL, MySQL, or another supported engine.
-
Fill in the connection details.
-
Once the details are entered, click Create to add the database.
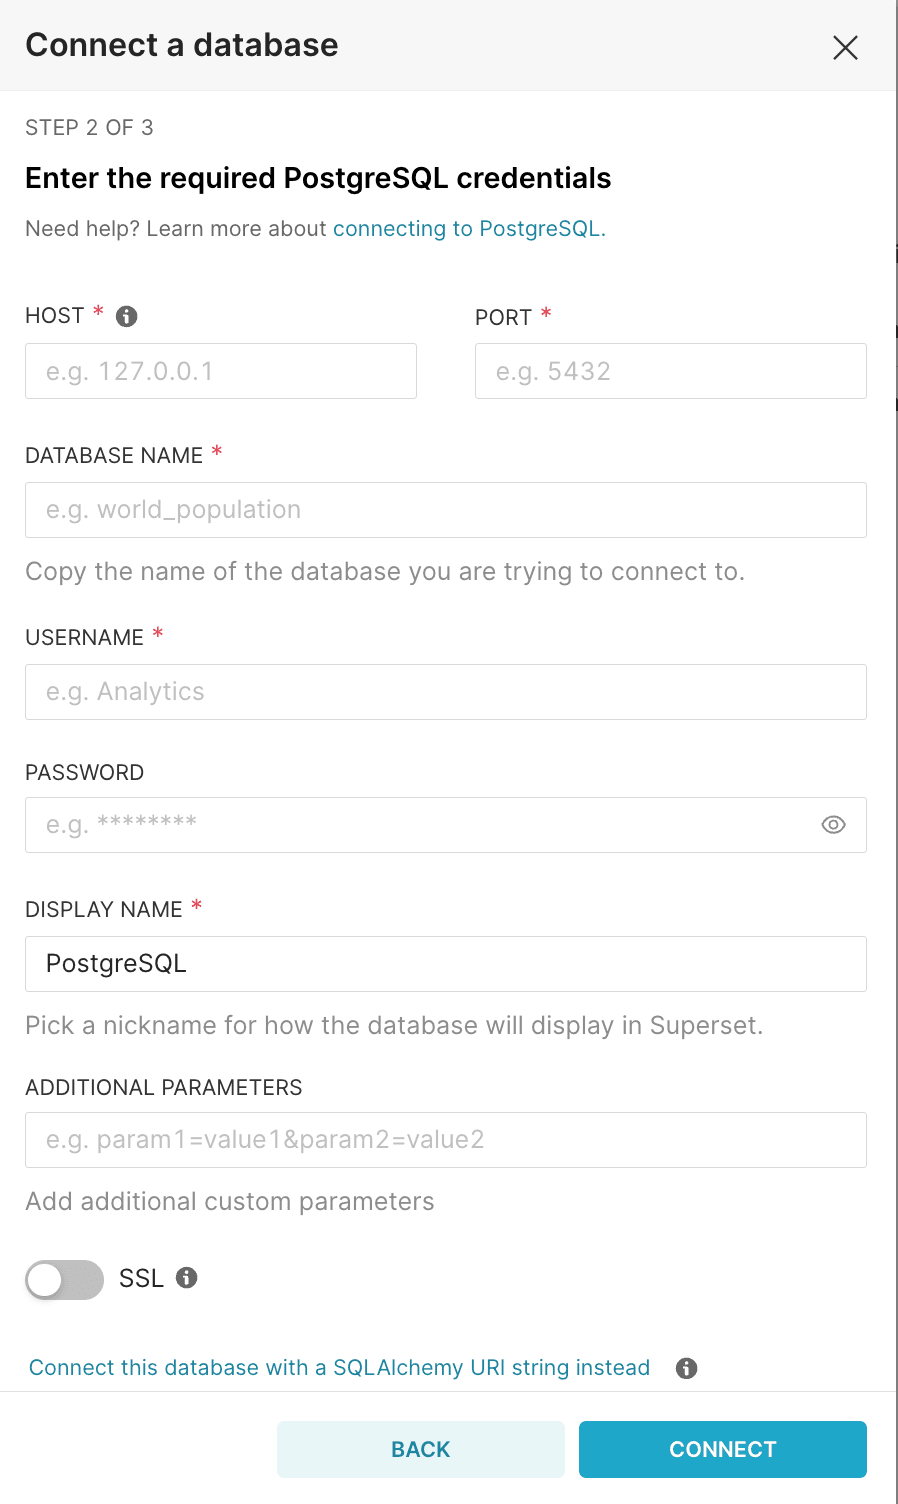
Superset will validate the connection, and if successful, our new database will appear in the list.
After the database is connected, we can import its tables into Datasets. From there, exploring the data becomes a matter of point-and-click — no extra setup required.
From Raw Data to Visual Stories
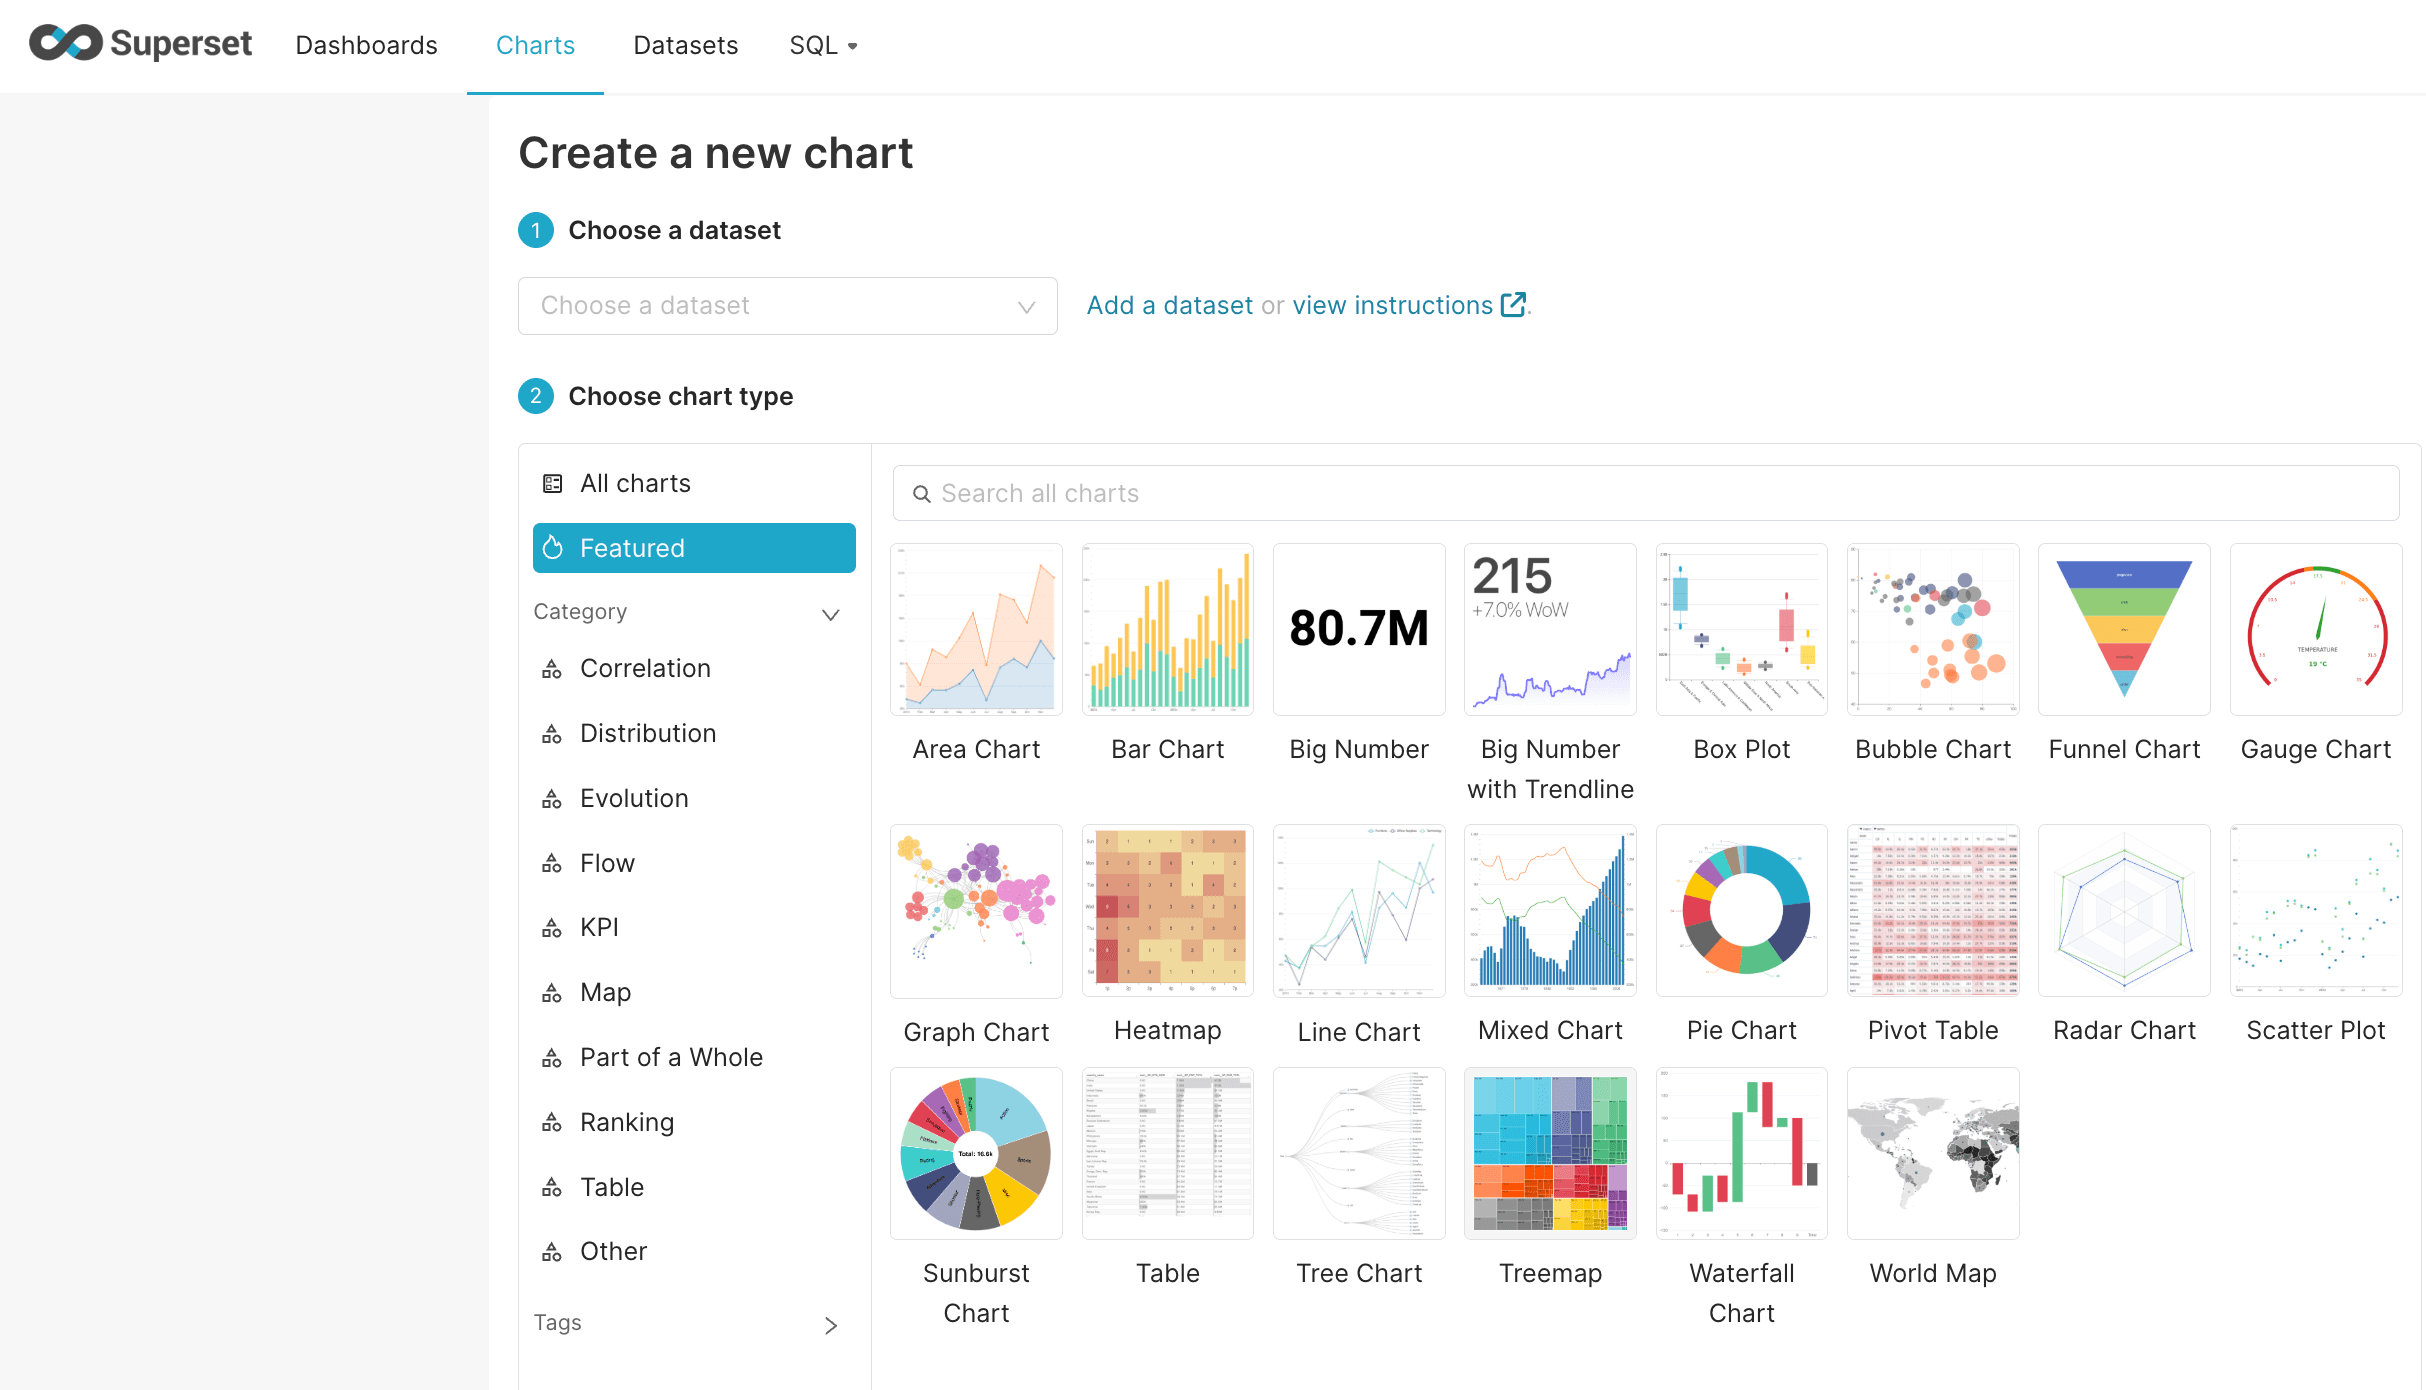
In Superset, the path to visualization depends on how we want to work with the data:
- Visual Explorer (no-code): To build charts here, we first need to create Datasets from our database tables. Datasets act as the foundation for charting and allow us to define which table (or query) is being visualized. Once the dataset is ready, we can pick a chart type—with Superset supporting common options like bar, line, pie, and time-series charts—then choose metrics and dimensions, and finally customize the visualization.
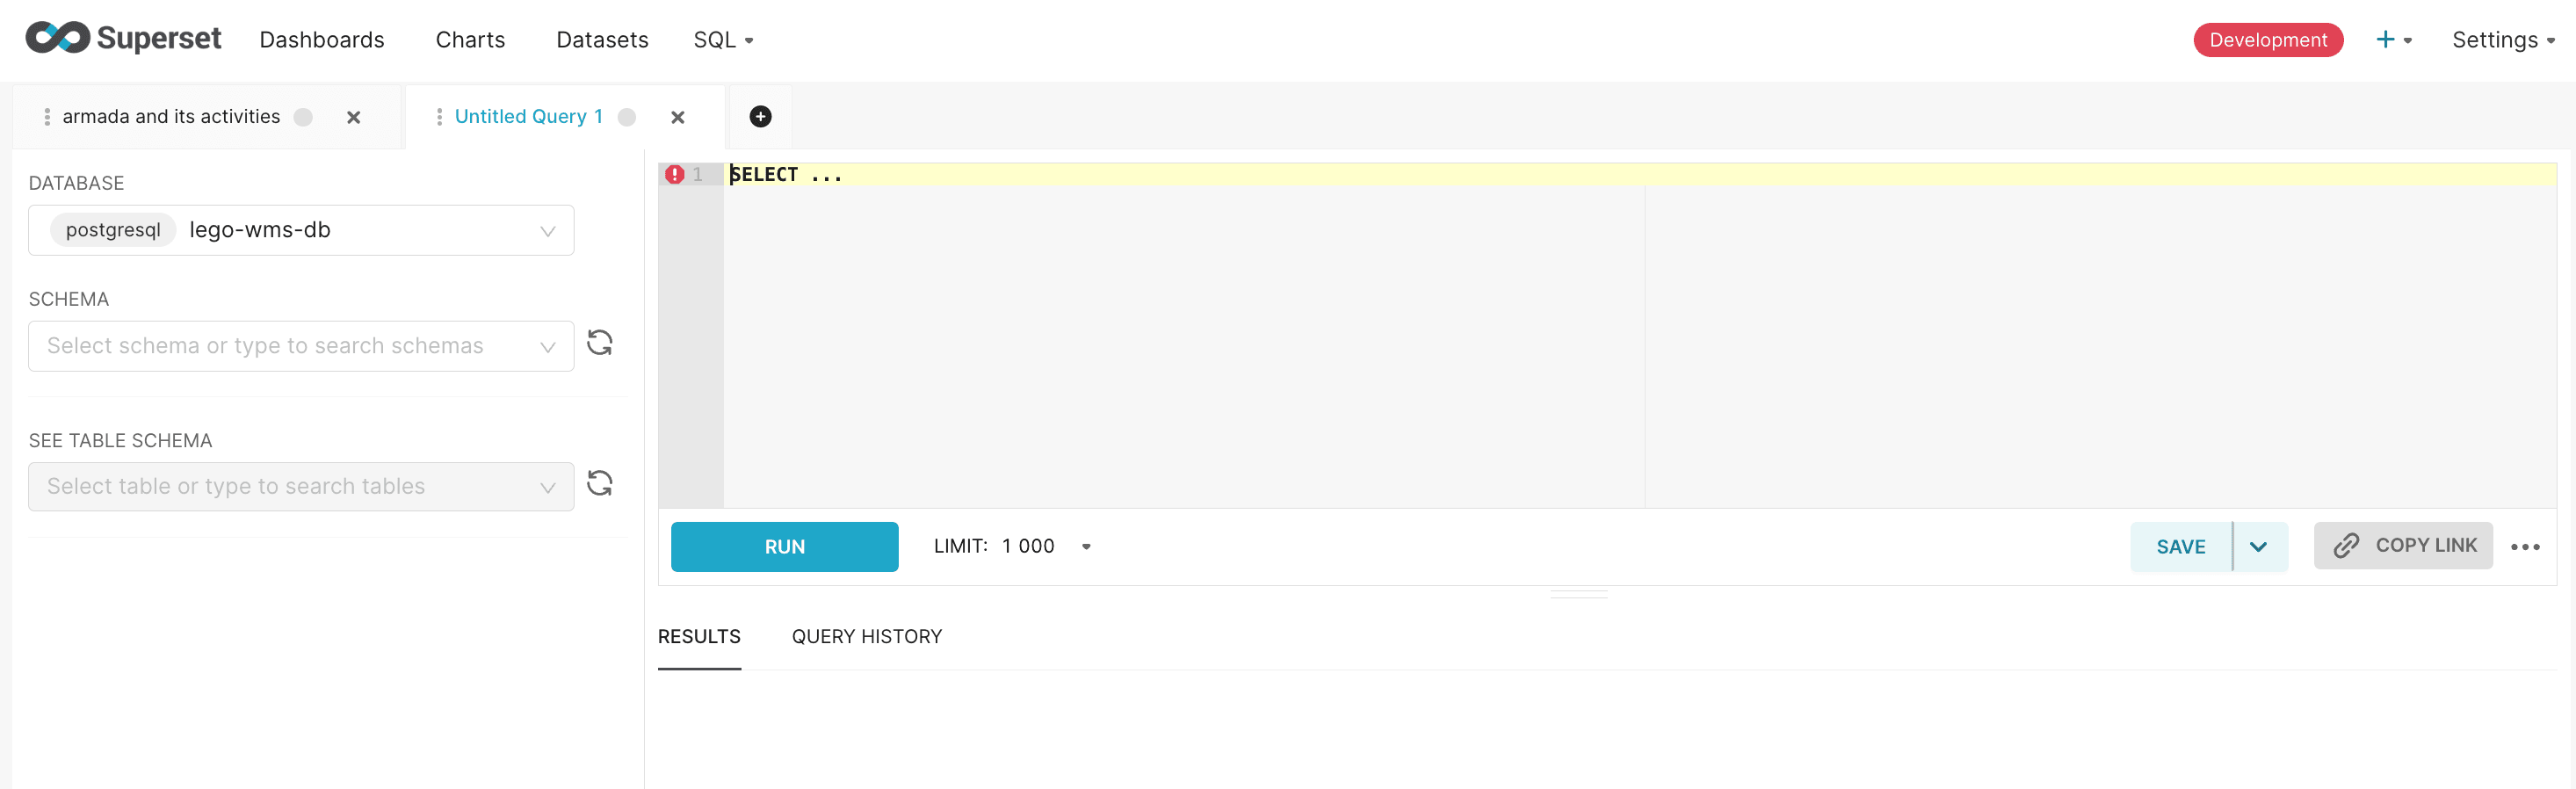
- SQL Lab (query-based): If we prefer writing SQL, we can query tables directly without creating a dataset. This is especially useful for joins, aggregations, or more advanced logic that goes beyond a single table.
One example I worked on:
A pie chart comparing department distribution (via Visual Explorer).
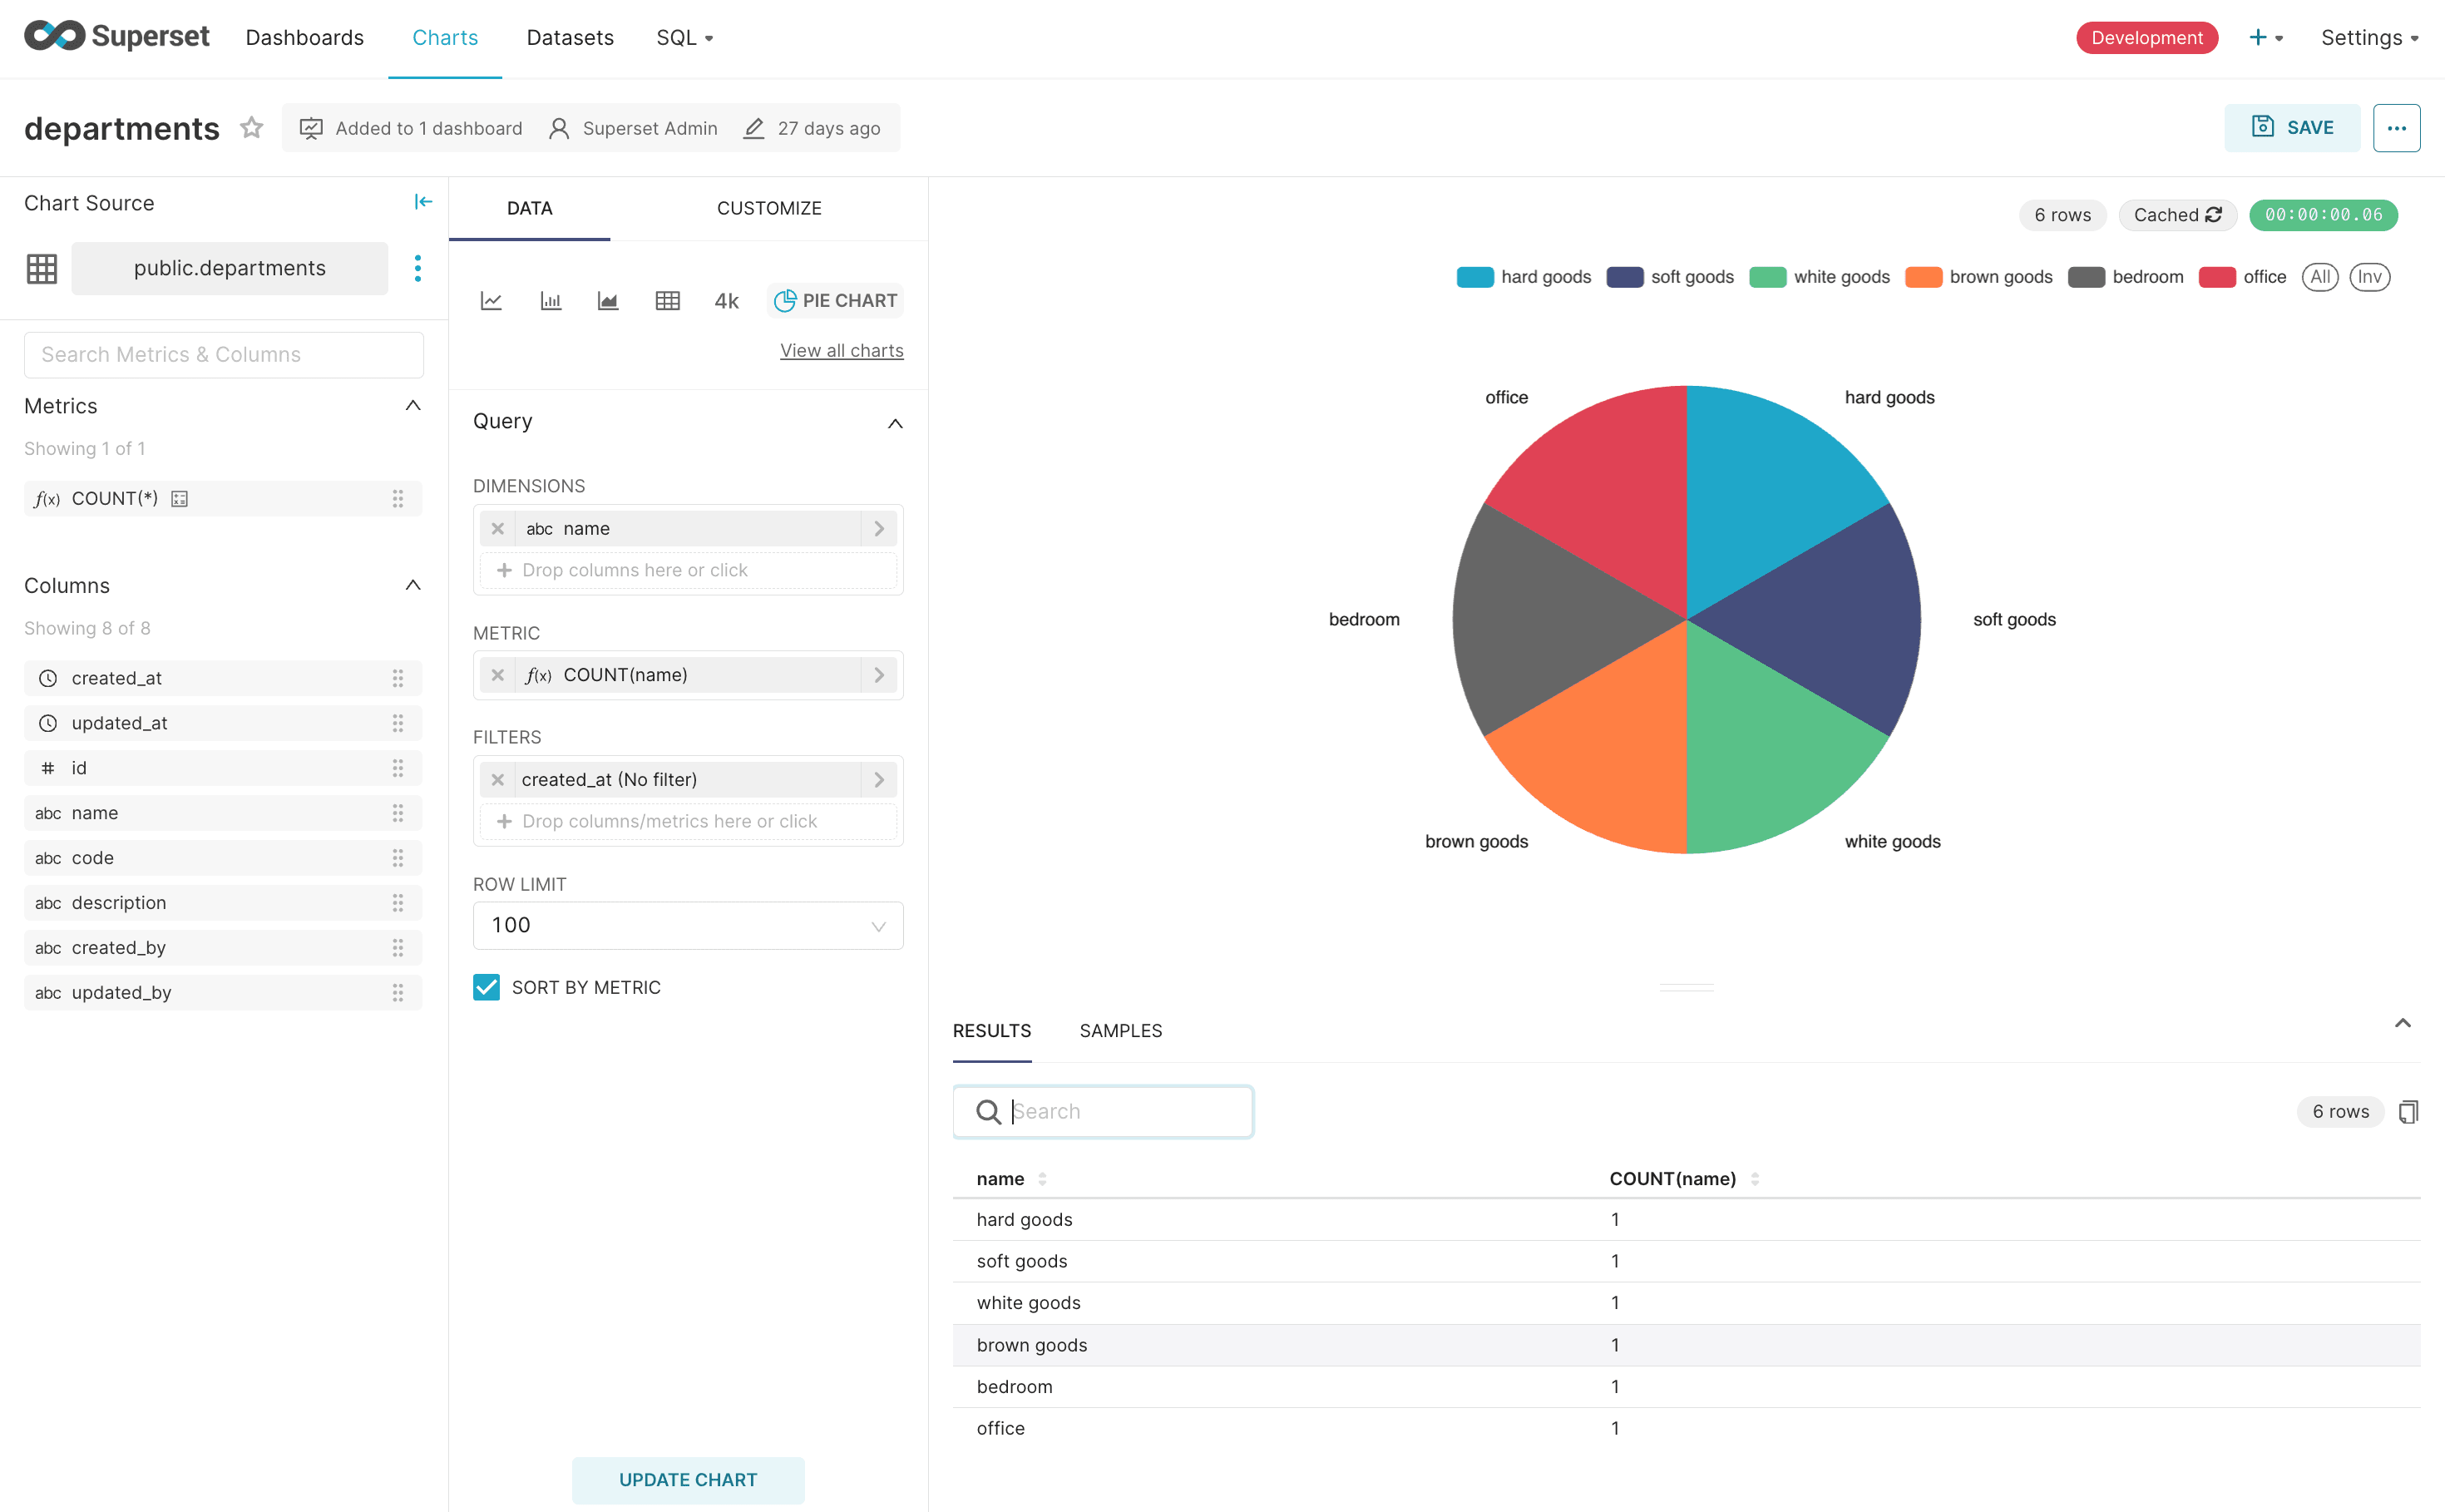
This dual approach — no-code charting with datasets and full SQL freedom when needed — makes Superset flexible for both business users and data teams.
Designing the Dashboard Experience
With my first chart ready, I added it to a dashboard. The drag-and-drop canvas makes it easy to arrange and resize charts as you build, while filters add interactivity.
The result was a clean, at-a-glance view of the project's most important insights — something that could easily be shared with teammates.
Taking Dashboards Beyond Superset
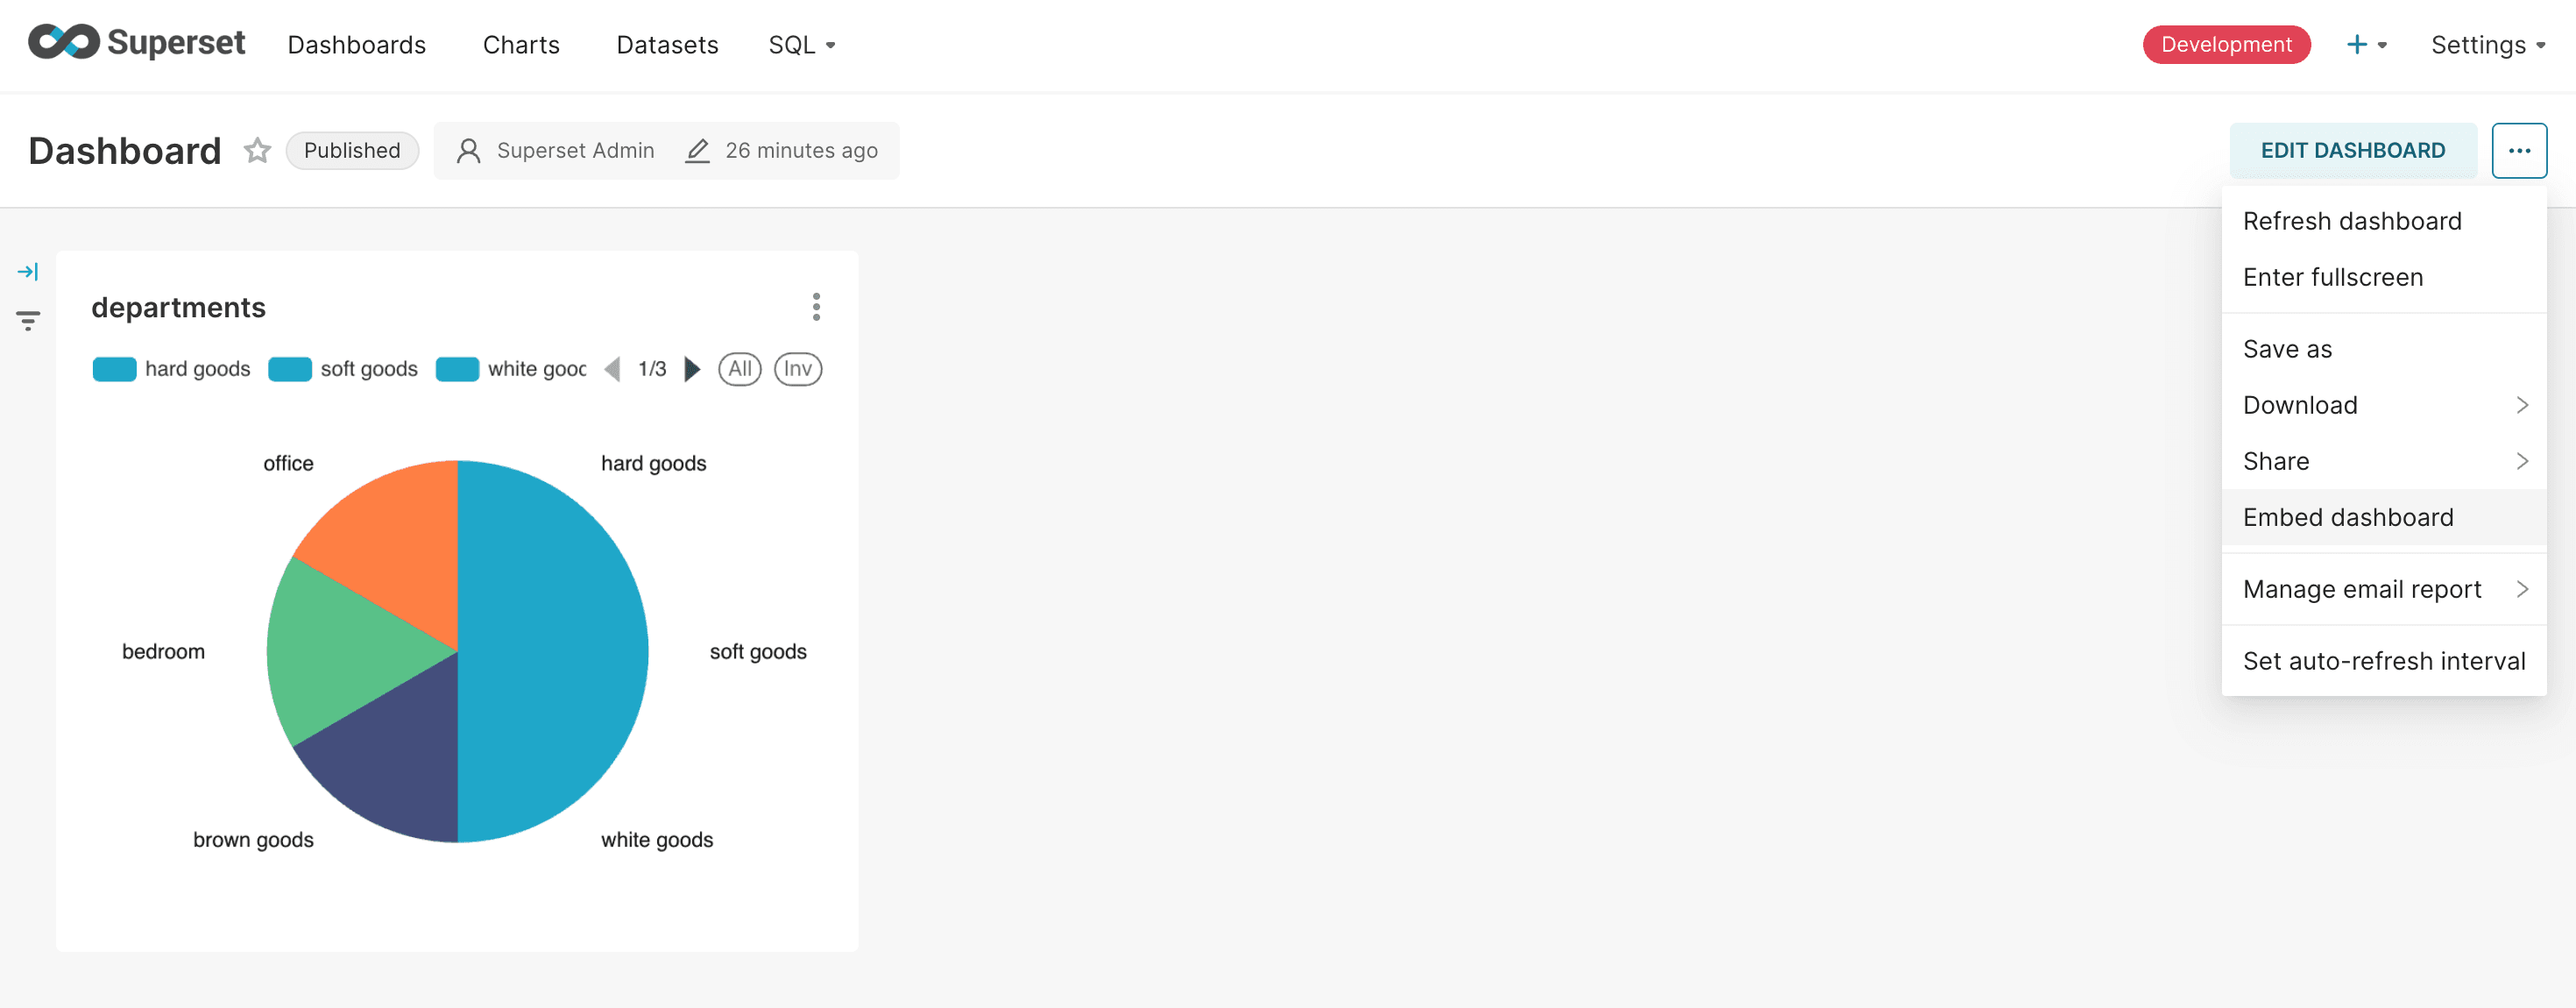
One of my key goals was to embed Superset dashboards directly into an application. Using Superset's embedding options, I was able to integrate the dashboard seamlessly.
Inside the application, the dashboard retained its interactivity and responsiveness, effectively extending Superset's power to end-users without them even needing to know Superset was running behind the scenes.
To embed a dashboard in our application, open the dashboard page in Superset and click on the three dots next to Edit Dashboard. From the menu, select Embed Dashboard — this will provide us with a unique dashboard ID.
Using the Superset Embedded SDK, we can pass this ID into the SDK to seamlessly embed the dashboard within our application.
embedDashboard({
  id: "abc123", // given by the Superset embedding UI
  supersetDomain: "https://superset.example.com",
  mountPoint: document.getElementById("my-superset-container"), // any html element that can contain an iframe
  fetchGuestToken: () => fetchGuestTokenFromBackend(),
  dashboardUiConfig: { // dashboard UI config: hideTitle, hideTab, hideChartControls, filters.visible, filters.expanded (optional), urlParams (optional)
      hideTitle: true,
      filters: {
          expanded: true,
      },
      urlParams: {
          foo: 'value1',
          bar: 'value2',
          // ...
      }
  },
});
Role-Based Access Control (RBAC)
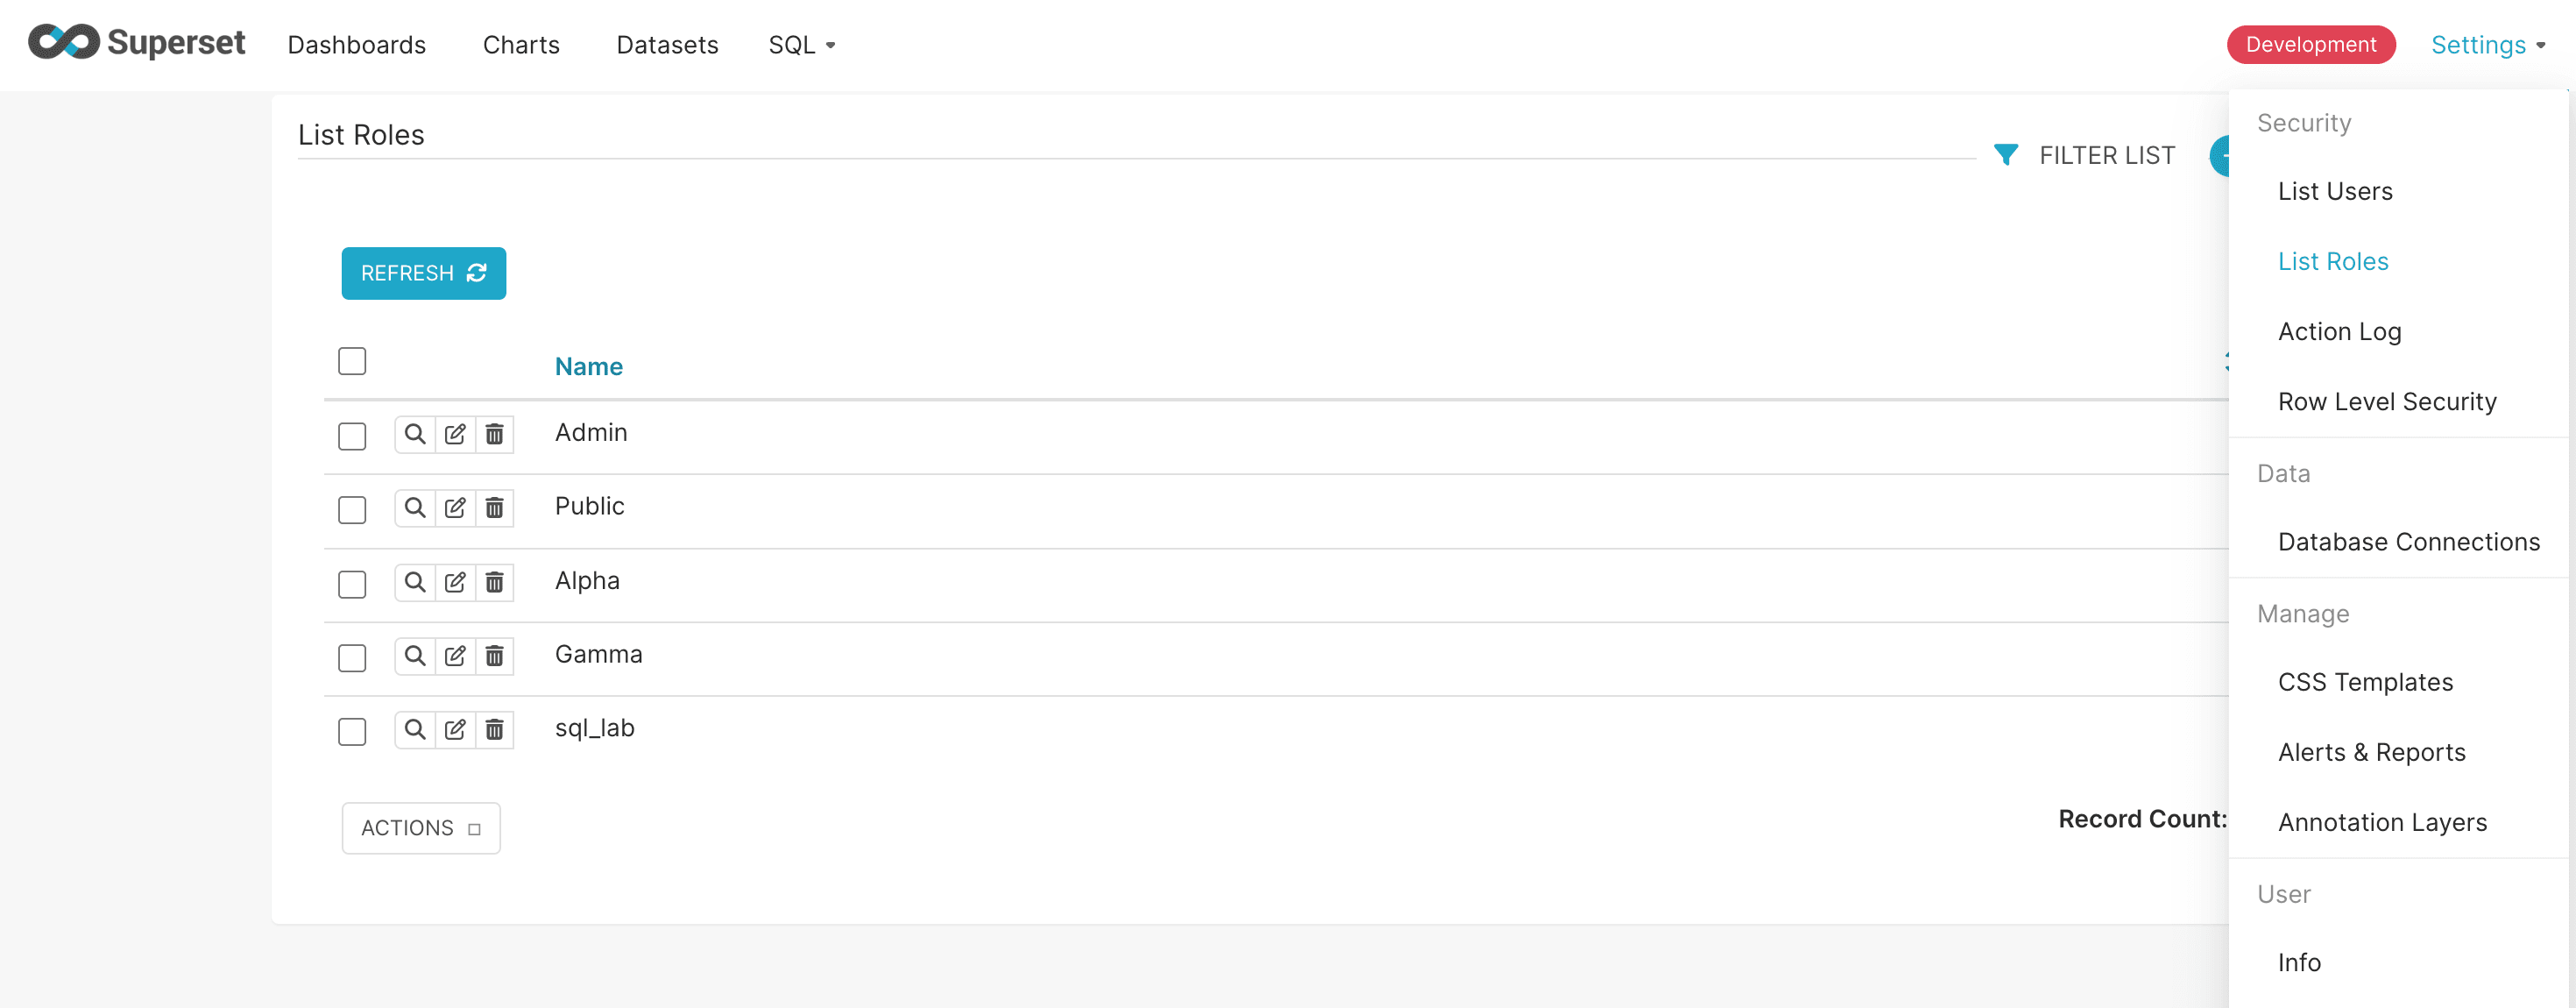
Superset comes with a well-defined roles and permissions structure that makes it easy to control who can see what. Under the Settings menu, we'll find options to manage both Users and Roles.
Here's how I explored RBAC in Superset:
-
Reviewed the list of available roles and created custom ones with restricted access to specific dashboards or datasets.
-
Assigned these roles to test users from the Users section.
-
Validated that users only had access to the content permitted by their role.
This confirmed that restricted dashboards and datasets remain completely hidden from unauthorized roles, giving teams fine-grained control over data visibility.
🔑 Real-World Example of RBAC in Superset
Imagine a company with multiple teams using Superset:
-
Sales Team → needs access only to dashboards that track leads, conversions, and revenue.
-
Marketing Team → should only see campaign performance dashboards and engagement metrics.
-
Finance Team → requires access to revenue, expenses, and forecasting dashboards.
-
Executives → need a consolidated, high-level view across all departments.
With RBAC in Superset, admins can assign each team a role that restricts their access to only the datasets and dashboards they need. For instance, Sales won’t see Finance data, and Marketing won’t see Sales leads, while executives can be given broader access. This ensures both data security and relevance, reducing clutter for end users.
Thanks for Reading! 🎉
If you’ve made it this far, you’ve successfully taken your first steps into the world of Apache Superset. You now know how to turn datasets into rich visualizations and craft dashboards that bring clarity to the chaos of raw data.
It might feel like a small achievement, but what you’ve unlocked is huge—you’re paving the way for deeper insights, smarter strategies, and a more data-driven way of working. That’s something worth raising a toast to! 🚀
Here’s to building dashboards that don’t just look great but also tell the story behind the numbers. 📊✨